As a facility for the user the BPnd (6 Calc. Methods) "model" has been implemented which calculates BPnd using six reference methods in a single processing. For a description of the idividual models please refer to the following links: SRTM, SRTM2, Logan, MRTM0, MRTM and MRTM2.
This model allows fitting a reference tissue k2' which is used in the SRTM2 and MRTM2 methods using the SRTM method. If this option is not used, an appropriate k2' has to be manually entered. The model also allows fitting a t* using the Logan reference plot based on the k2' determined beforehand.
Acquisition and Data Requirements
Image Data |
A dynamic PET data set with an appropriate neuroreceptor tracer. |
Target tissue |
Optional: TAC from a receptor-rich region (such as basal ganglia for D2 receptors). For visualization of model fitting and optionally for fitting k2' |
Reference tissue |
Mandatory: TAC from a receptor-devoid region (such as cerebellum or frontal cortex for D2 receptors). Note: specification of an appropriate reference TAC is crucial for the result! |
VOI |
Optional: VOI definition excluding the reference tissue which can be used for getting an estimate of k2'. |
Model Preprocessing
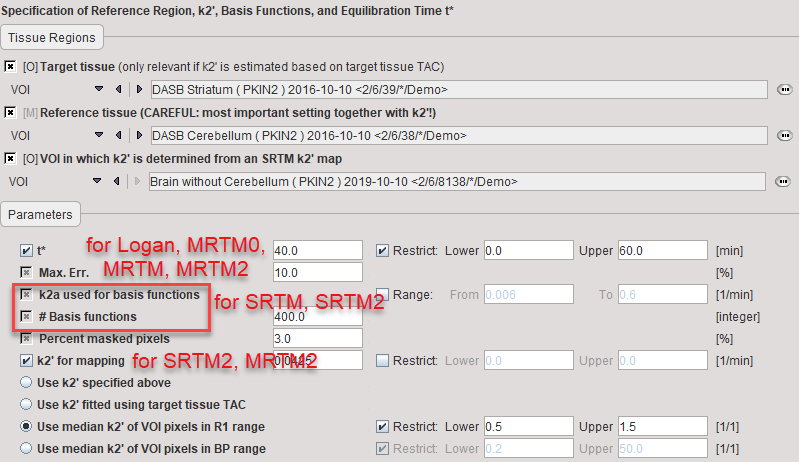
t* |
Start time of the data segment used for the estimation of BPnd. If the box of t* is checked an a Target tissue has been defined, it is fitted using the Logan Reference method and the specified Max. Err. criterion. Otherwise, the specified t* value is applied. Note that all methods requiring a t* will use the same value from this preprocessing step. |
Max. Err. |
Maximal allowed relative error between measurement and prediction in the data segment starting from t*. |
k2a used for basis functions |
Enter the minimal value of k2a (slowest decay of exponential) and the maximal value of k2a (fastest decay of exponential) after checking the Range box. |
# Basis functions |
Number of basis functions between the minima and maximal k2a. Note that increments are taken at logarithmic steps. This number is directly proportional to processing time. |
Percent masked pixels |
Exclude the specified percentage of pixels based on histogram analysis of integrated signal energy. Not applied in the presence of a defined mask. |
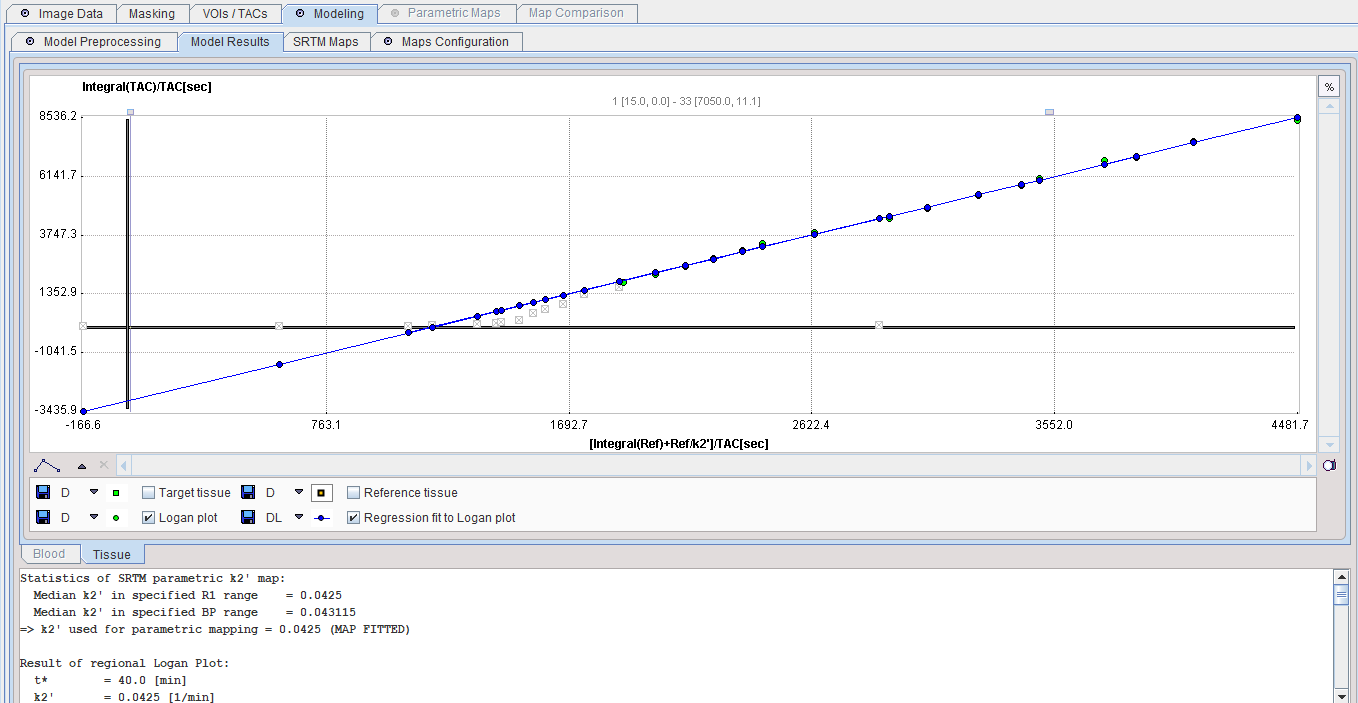
k2' for mapping |
k2 of the reference tissue. It can be specified in four different ways, as explained in section Specification of k2'. |
The result of a model fit during Model Preprocessing is shown in the Model Results panel for inspection. If no Target tissue is specified, the panel remains empty.
Note that the Model Preprocessing of all models is shown in the Info are and can be inspected by scrolling the window.
Model Configuration
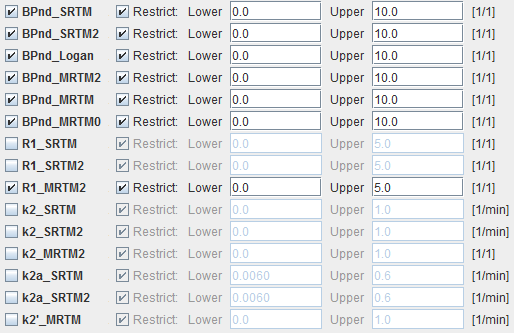
BPnd_X |
Binding potential estimated with the methods X = SRTM, SRTM2, Logan, MRTM2, MRTM, MRTM0 |
R1_X |
Ratio of tracer delivery in each pixel relative to the reference tissue (RI=K1/K1'). This map is often similar to a perfusion image and can therefore be helpful as an anatomical reference. |
k2_X |
Estimated efflux rate constant k2. |
k2a_X |
Map of the k2a value which provides the best fit. |
k2'_MRTM |
k2 of the reference tissue which is fitted by MRTM in each pixel. It will show variation, although it should be constant as always the same reference tissue is used. |
Note: The k2a parametric map should be checked in the initial setup of a processing protocol. The estimated k2a values should not be truncated by too narrow a k2a range.