The 3D scatter plot works along the lines of the 2D scatter plot and requires 3 registered images. After activating ![]() from the lateral taskbar a dialog window appears for configuring the 3 image series to compare.
from the lateral taskbar a dialog window appears for configuring the 3 image series to compare.
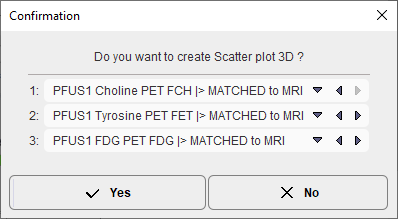
If the series selection is not yet proper, it can be corrected before proceeding. Note that the VOI of the first series will be used. If none exist, the following dialog window shows up.
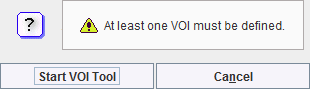
Start VOI Tool starts VOI definition, and the usual functionality can be applied for defining a list of VOIs.
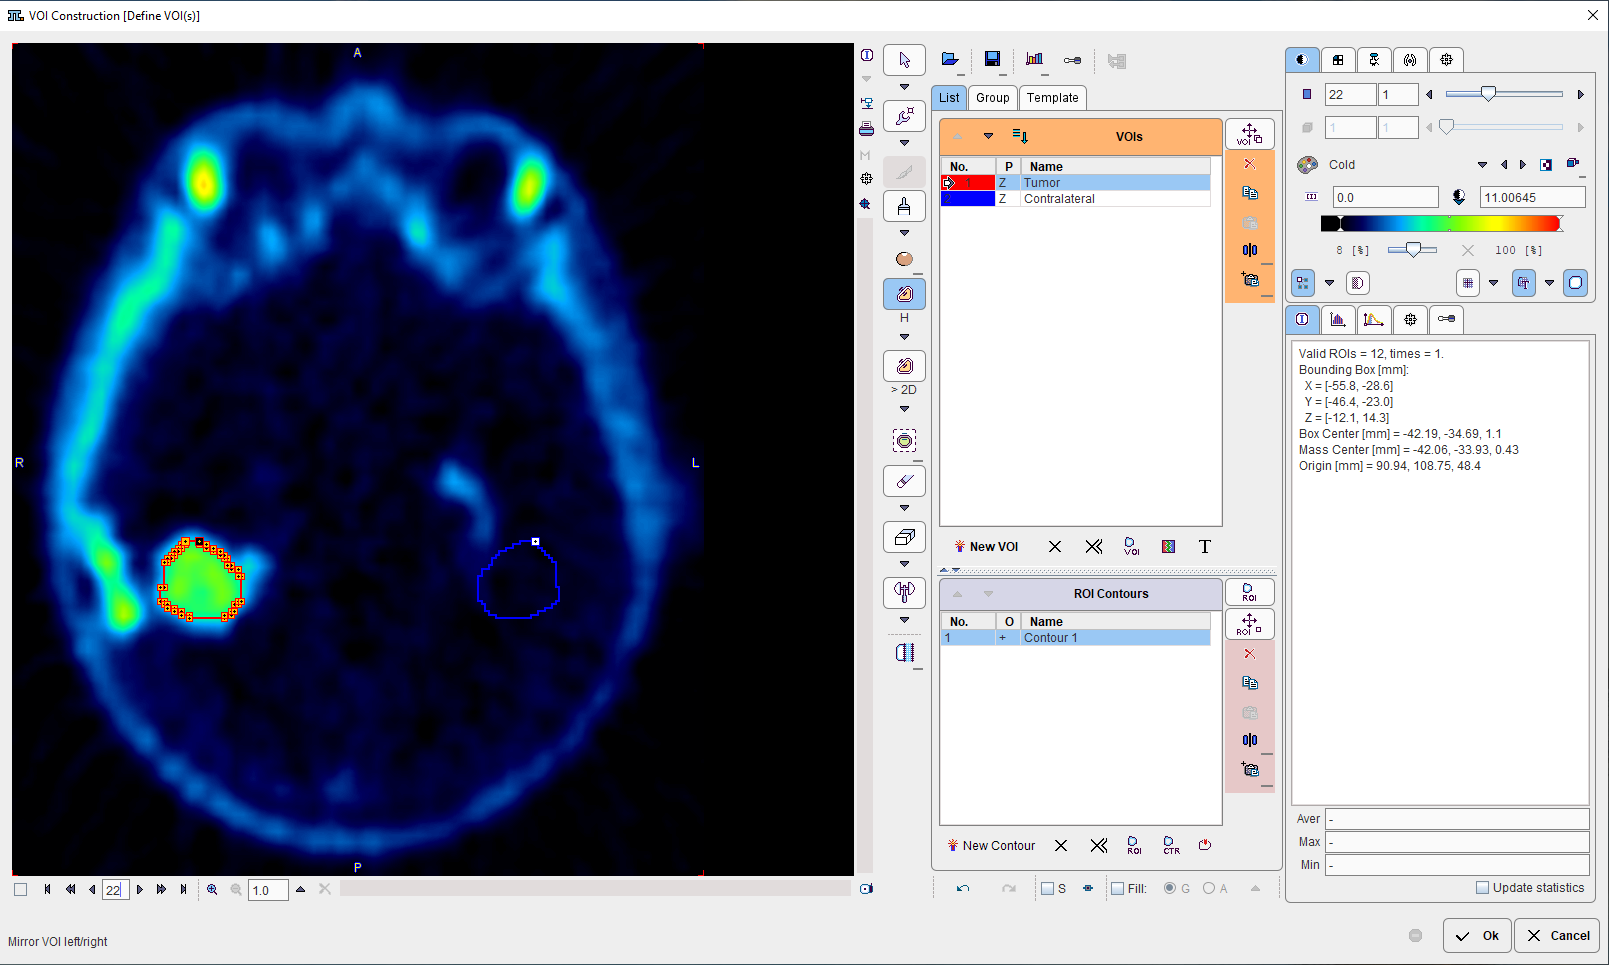
After confirming with Ok, the value of each VOI pixel is calculated in all three series, and a 3D plot generated.
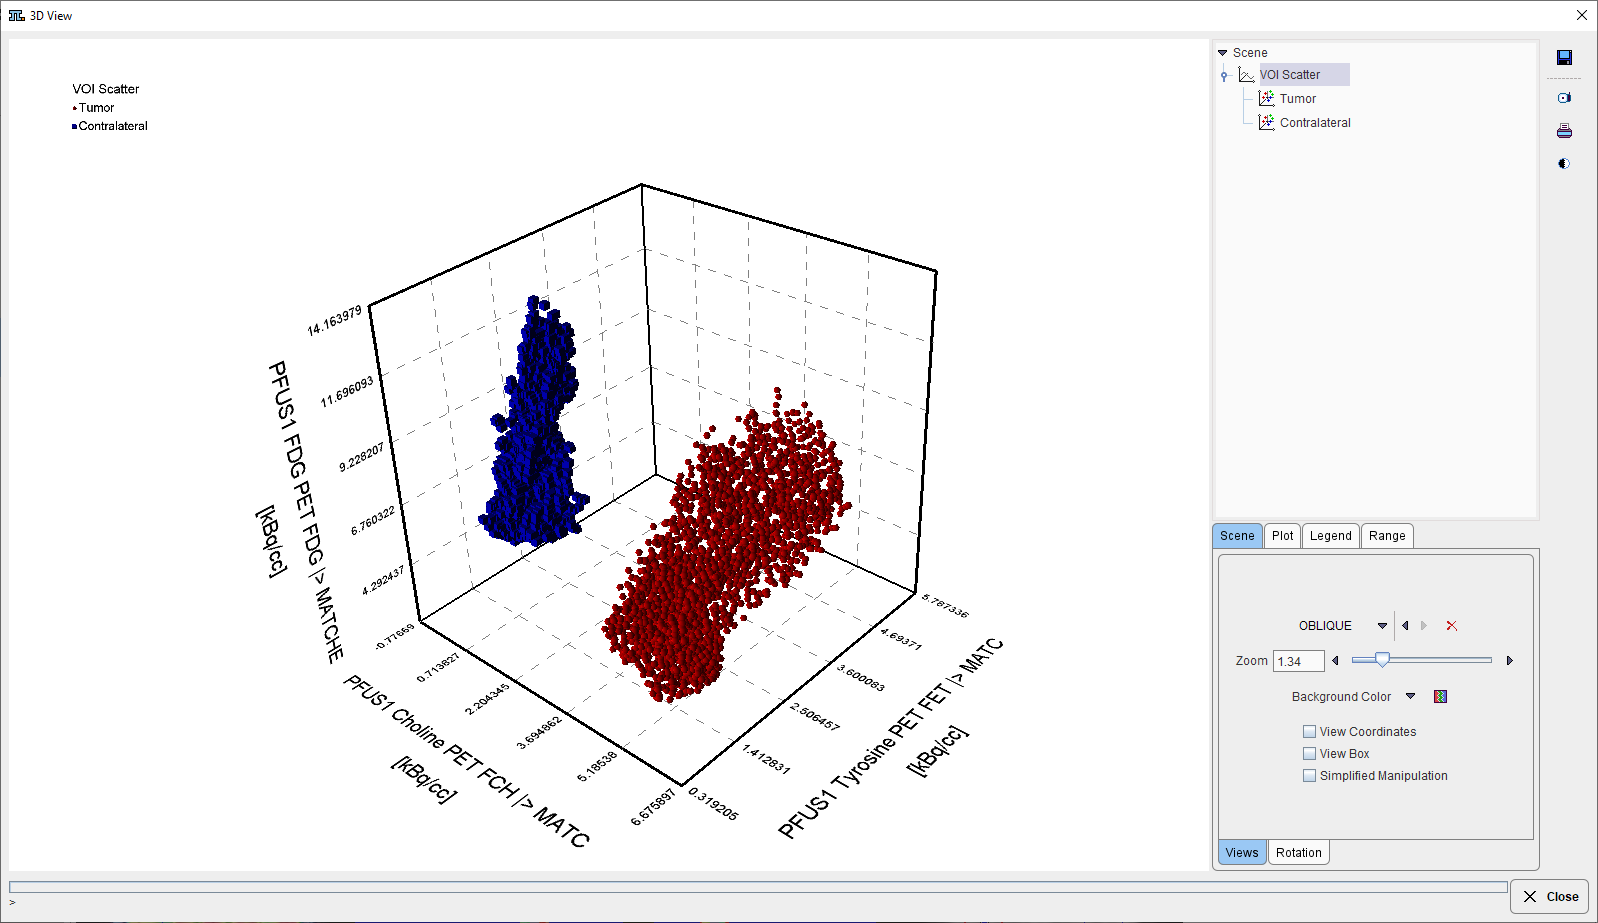
In this scatter plot, each point represents a VOI pixel. The color serves for labeling the different VOIs. Please refer to the P3D Users Guide for information about the 3D rendering options.
The actual data values can be exported by the save button in the lateral taskbar.