The best way to prepare the data of interest is arranging them on the Comparison main page in a three-row layout, and then activating the Passing-Bablok selection with the black down arrow located under the ![]() icon in the lateral taskbar:
icon in the lateral taskbar:
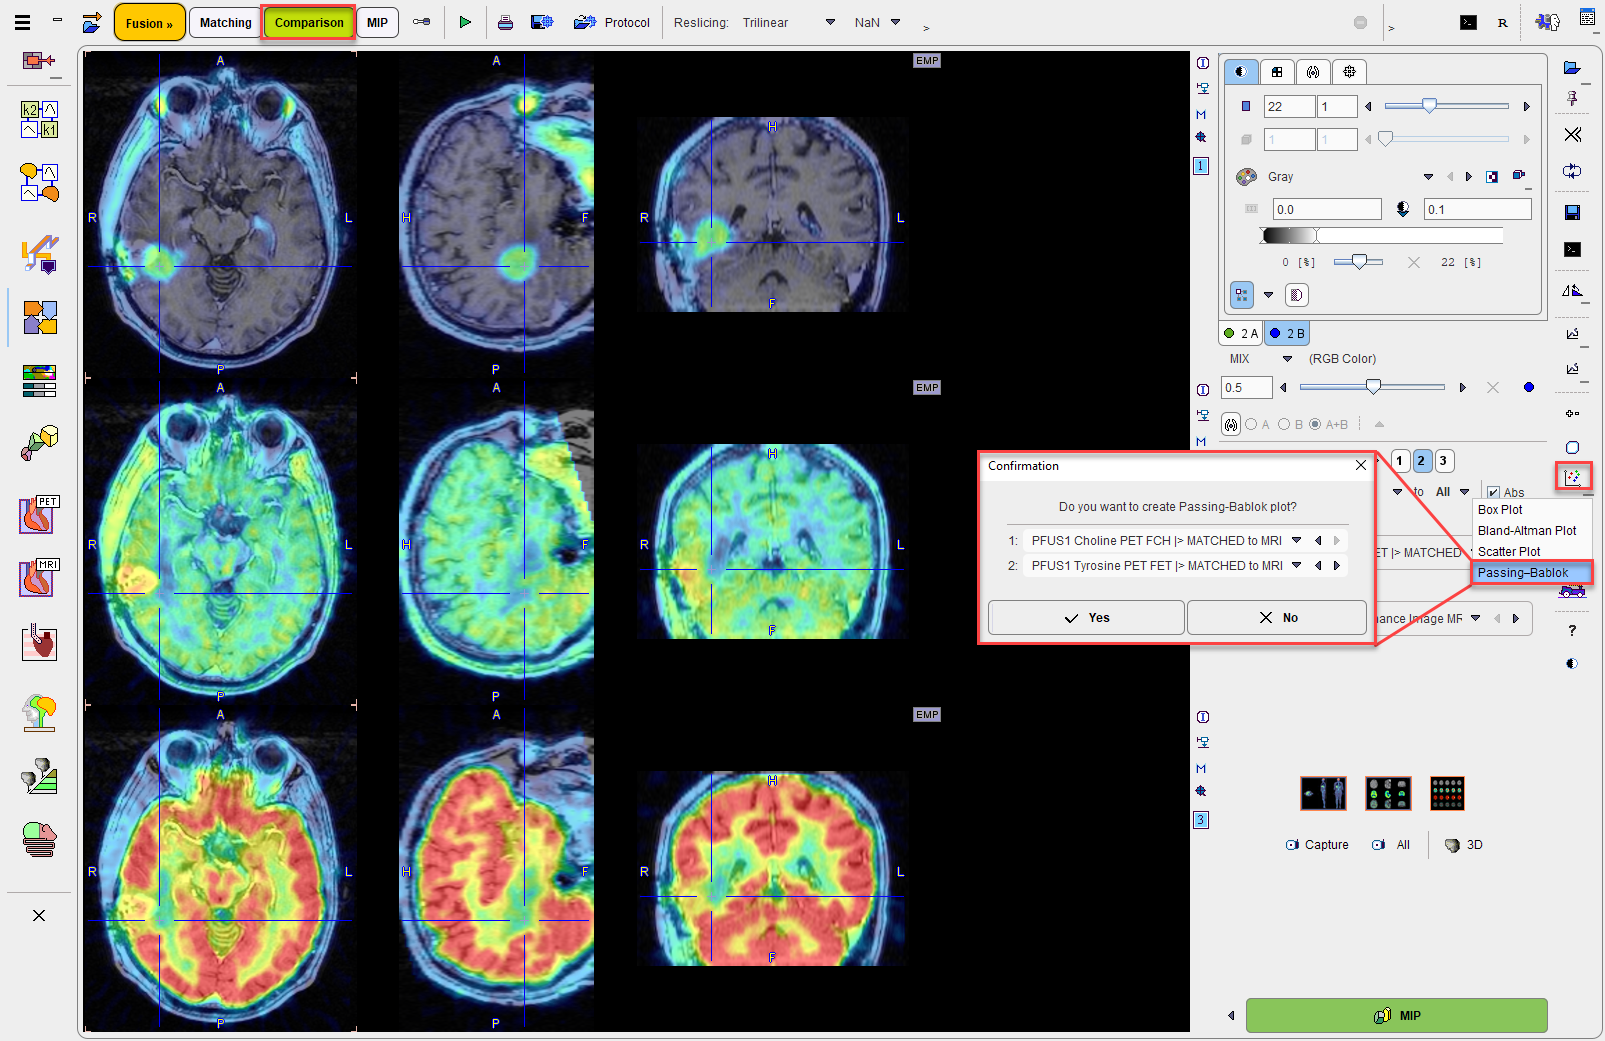
A dialog window is shown for configuring the 2 image series for which the result will be shown. If the series selection is not yet proper, it can be corrected before proceeding.
The plot requires VOIs to exist in the first series. If this is not the case, a dialog window appears:
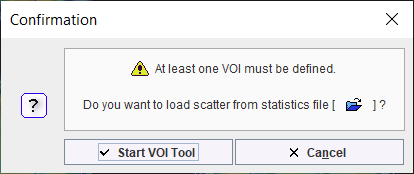
and Start VOI Tool used to enter VOI definition. The usual PMOD functionality can be applied for defining a list of VOIs.
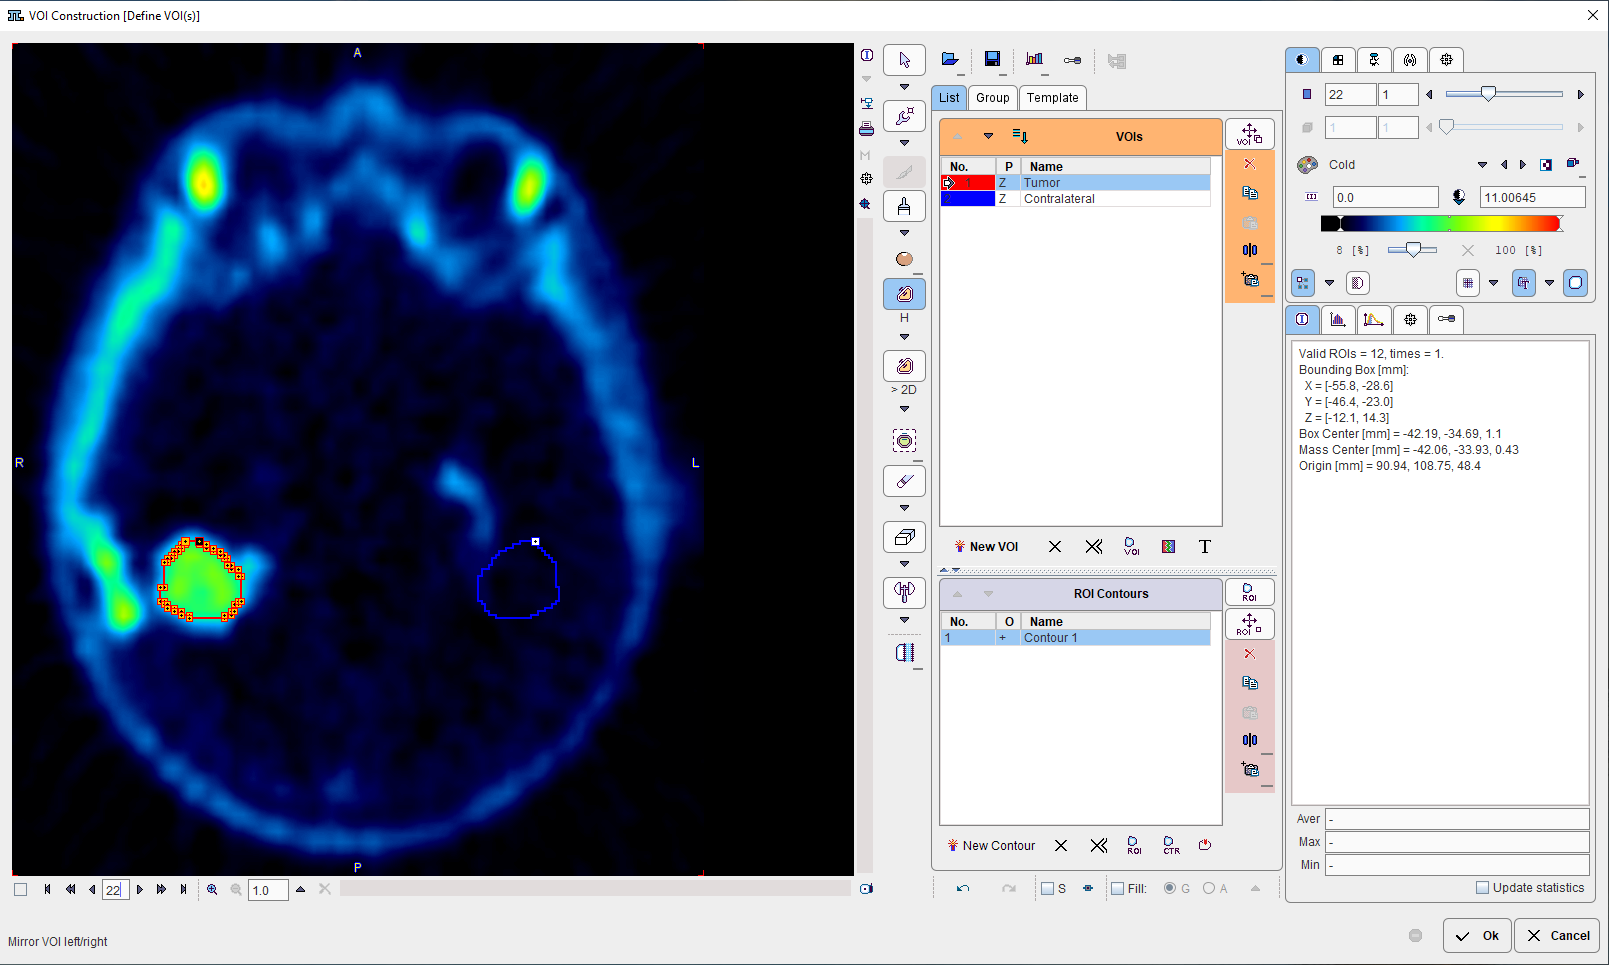
After confirming with Ok, the plot is calculated and generated in the PMOD-R interface.
The Passing–Bablok regression is a statistical method for non-parametric regression analysis suitable for method comparison studies. The Passing-Bablok procedure fits the parameters a and b of the linear equation y = a + b x using non-parametric methods. Please note that this procedure is valid only when a linear relationship exist between x and y variables.
The calculation for single VOI is time consuming. It is recommended to configure locally R if such regression analysis is of interest.
The graph shows the observations with the regression line (solid blue line), the confidence interval for the regression line (the violet interval) and the identity line (x=y, dotted red line):
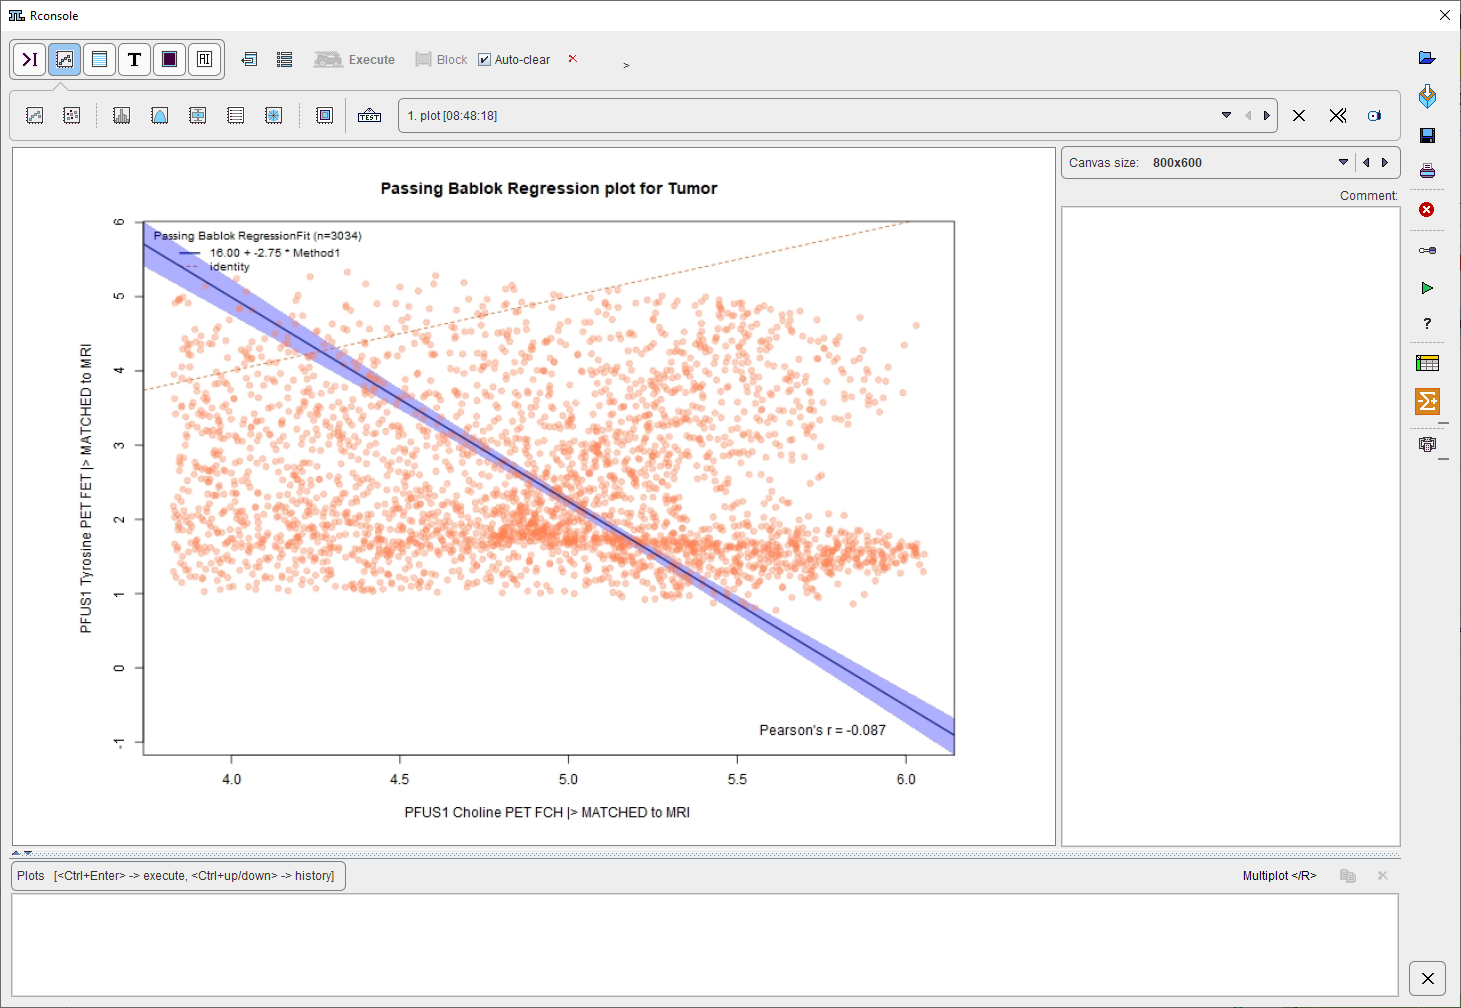
Particularly, in the scatter plot above, each point represents a VOI pixel. The pixel value in the first series (x, Choline in the example above) is plotted on the horizontal axis, and the value in the second series in the vertical axis (y, Tyrosine in the example above).