The scatter plot functionality allows investigating the values of pixels in two or three image series.
The best way to prepare the data of interest is arranging them on the Comparison main page in a two-row layout, and then activating the ![]() button in the lateral taskbar.
button in the lateral taskbar.
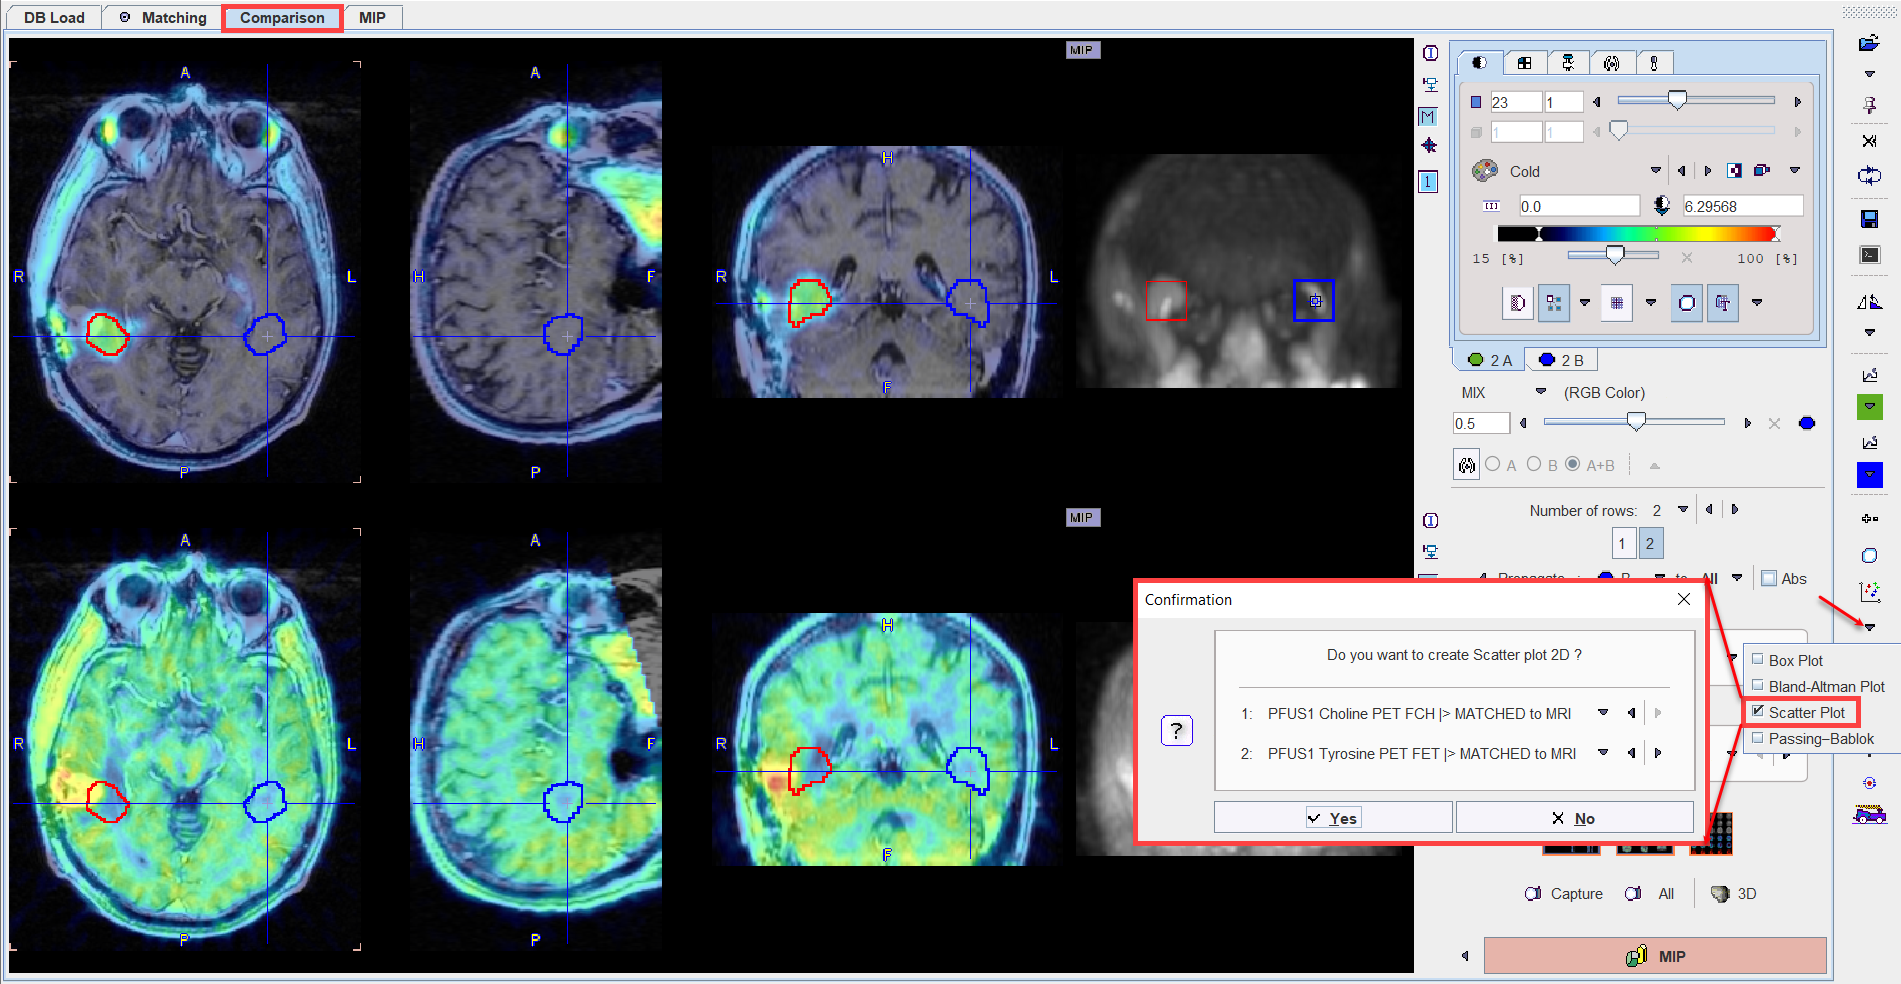
A dialog window is shown for configuring the 2 image series to compare. If the series selection is not yet proper, it can be corrected before proceeding.
The scatter plot requires VOIs to exist in the first series. If this is not the case, a dialog window appears
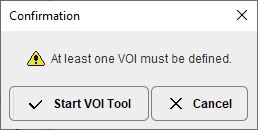
and Start VOI Tool used to enter VOI definition. The usual PMOD functionality can be applied for defining a list of VOIs.
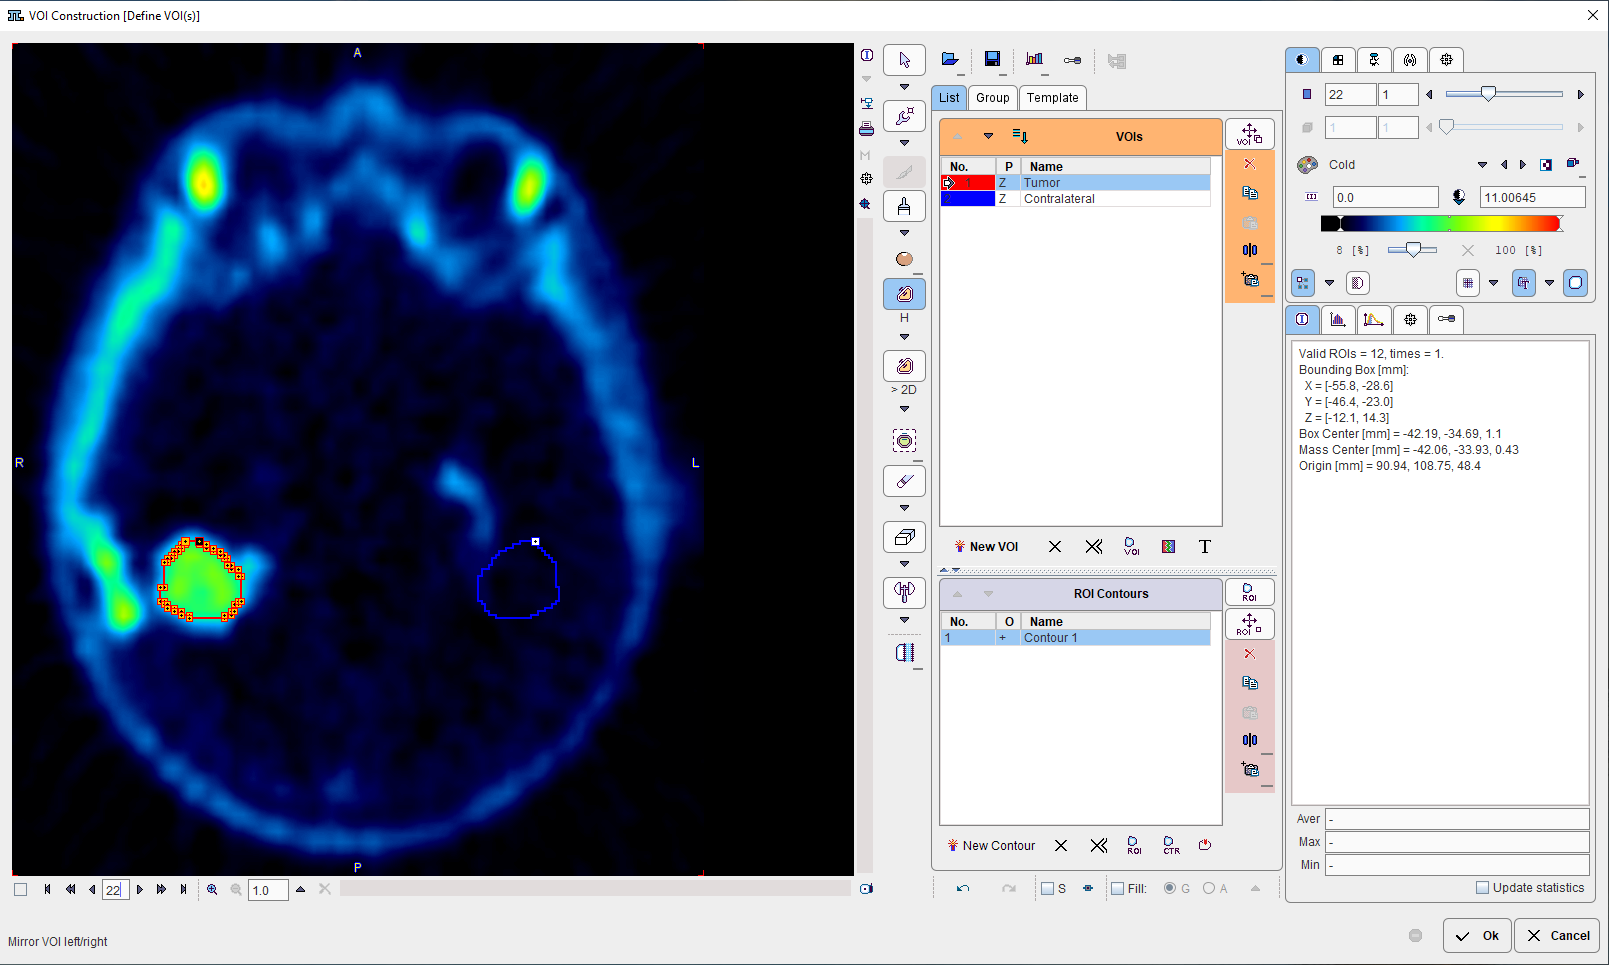
After confirming with Ok, the value of each VOI pixel is calculated in both series, and a scatter plot generated.
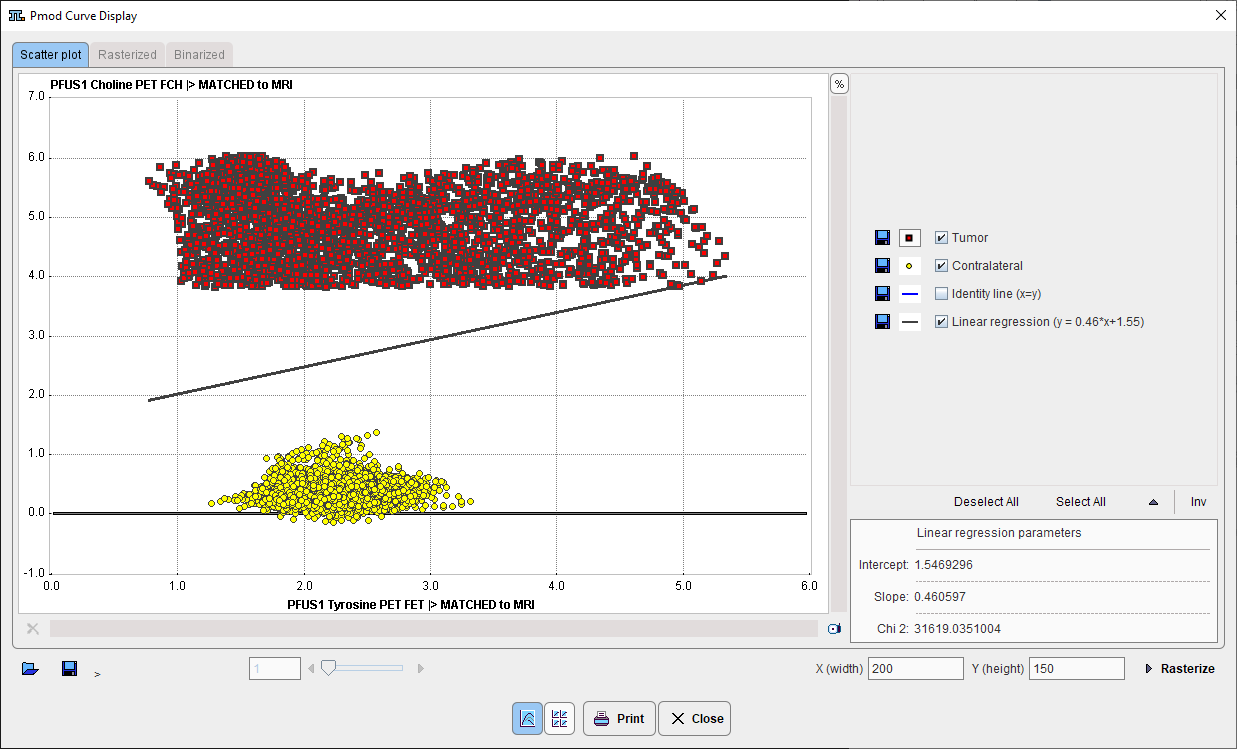
In this scatter plot, each point represents a VOI pixel. The color serves for labeling the different VOIs. The pixel value in the first series is plotted on the vertical axis, and the value in the second series in the horizontal axis. The actual data values can be exported by right-clicking into the plot and selecting Value table of visible curves or Save multiple curves.