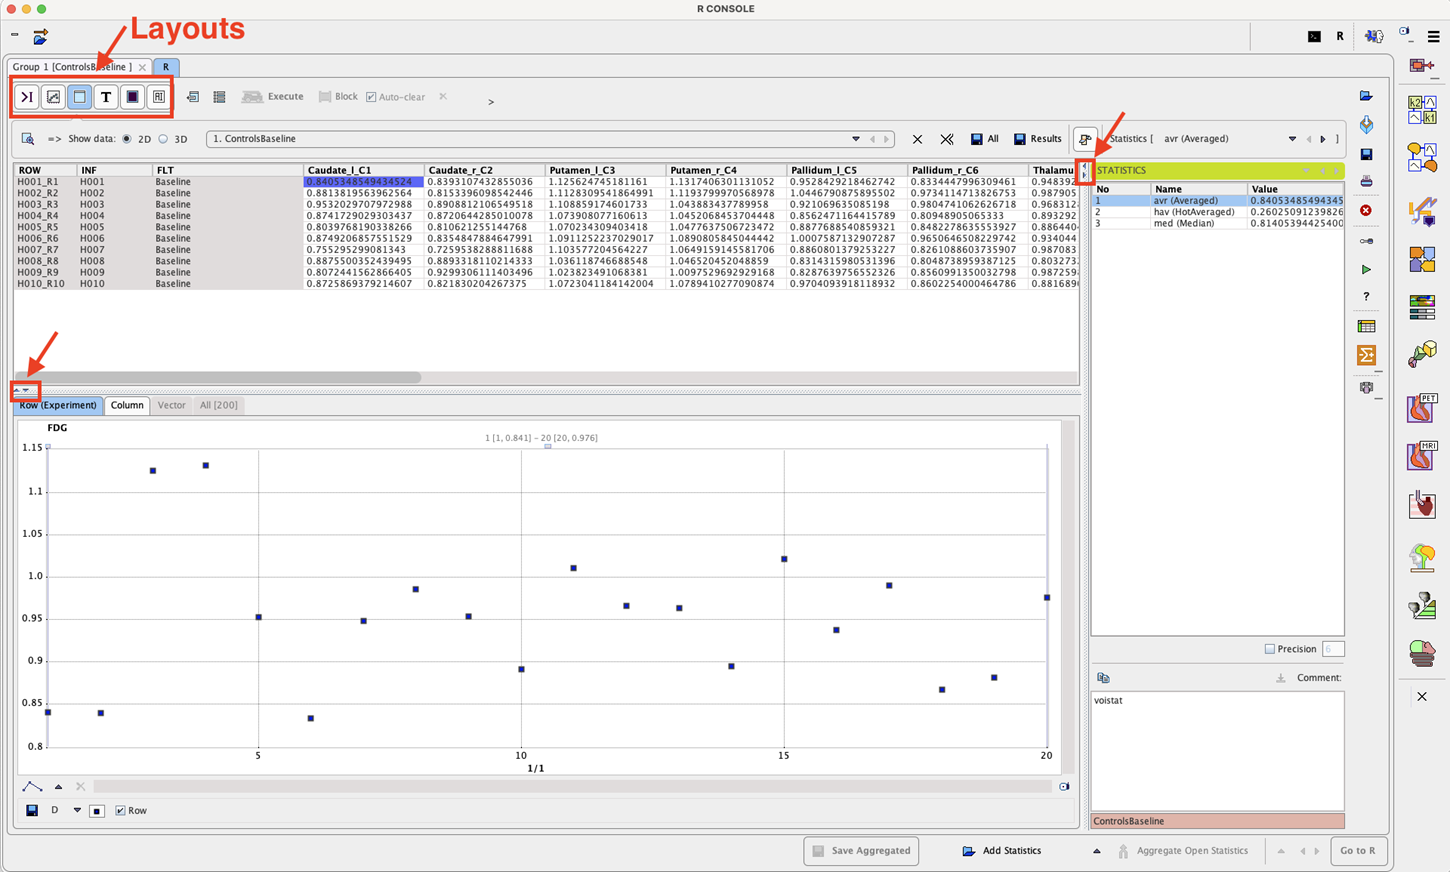
The user interface of the R console has some framework operations, a main part and a taskbar to the right.
Framework
There are some convenience buttons at the top of the window:
|
Buttons to minimize/maximize the docking window. |
|
Captures the entire screen (not only the PMOD window) and adds it to a console buffer. |
|
Opens the Console dialog window for checking the log output and reporting problems to support@pmod.com. |
|
Open help window. |
|
Button for opening the R server configuration window. |
|
Button for reconnecting to the R server, if a connection problem occurred. |
|
Dividers between different parts of the layout allow extending/shrinking the respective areas. |
Main Window Layouts
The main statistics part has 5 different layouts depending on selection in the upper left:
|
Command layout: Allows invoking existing analysis scripts as well as editing and executing native R commands on the loaded data. |
|
Plotting layout: Allows producing different plots of the data, and inspecting the plots produced by analysis scripts. |
|
Table layout: Allows inspecting the data variables of the R workspace. Initially, the loaded data appear as variables g1, g2, etc. Scripts add variables to the workspace. Data can be copied to the clipboard for external usage. |
|
Text layout: Allows extracting the contents of numerical variables into a text field. |
|
Image layout: Allows visualizing images. Is only active after image data have been transferred. |
|
PAI Monitor: Allows visualizing the PAI training progress. |
Next to the layout buttons is an area containing several buttons
![]()
which are related to programming in R and effective in different contexts:
|
Generates R code for extracting parts of the workspace variables. |
|
Lists the variables in the workspace and inserts the selected variable into the command line. |
|
Executes the whole code in the command window. |
|
Executes the selected code in the command window. |
|
Clears the contents of the command window after execution. |
Lateral Taskbar
The elements in the taskbar have the following functionality:
|
▪Loading of information as described below. |
|
Input files can be dragged to this box for opening them |
|
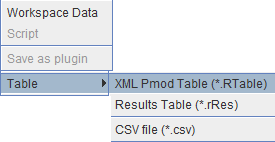
Saving of ▪the contents of the command window in two ways: as a new Script , which can be loaded, or as a plugin, which can directly be selected from a list; ▪all data variables as an R workspace (Workspace Data, .RData file) which can be loaded back into the PMOD R console, but also directly to R or other graphical front-ends of R (e.g. R Studio). ▪matrices can be saved as Table CSV files. |
|
Printing a report which may include plots, tables and/or images, depending on the analysis performed. |
|
Clears all the variables in the R workspace. |
|
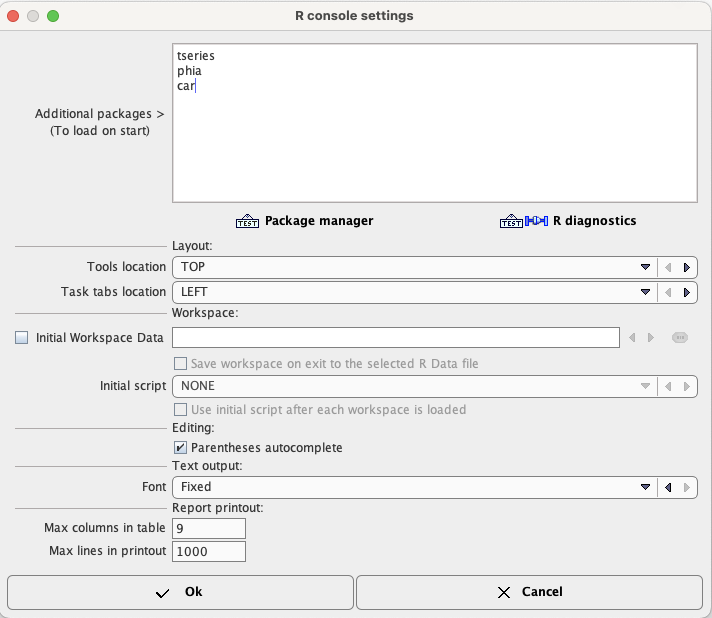
Opens the configuration settings window:
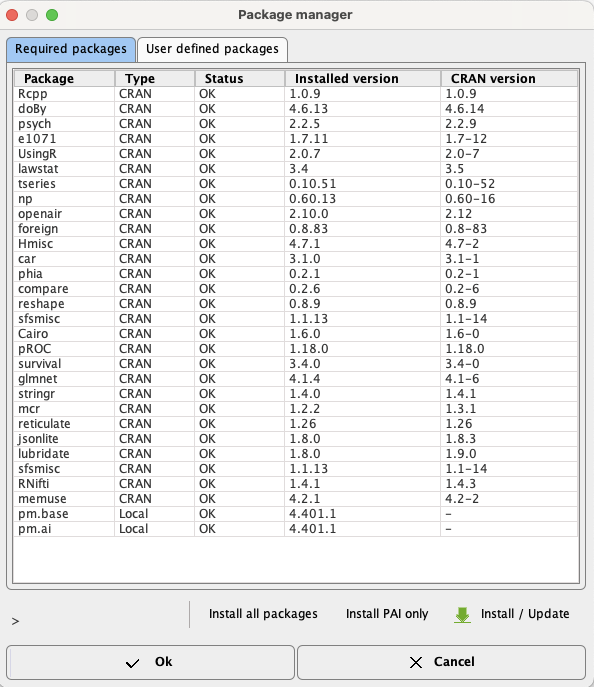
Tools location is layout option. The tools section may be arranged at the Top (as in this documentation), or at the Bottom. Initial Workspace Data directs the R console to load an R workspace file whenever it is started. This file might include R functions developed by the user. If user scripts require additional R packages, they can be typed into the Additional packages ... window and checked with the Verify ... button.
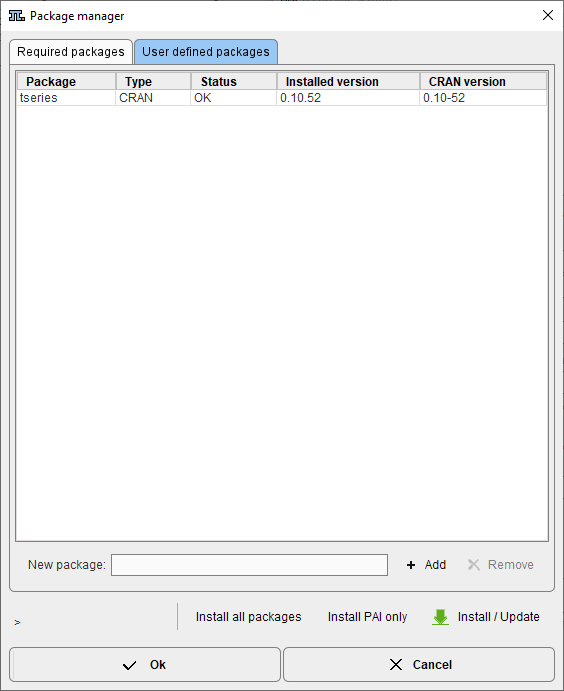
If user scripts require additional R packages, they can be typed into the New packages ... field in the User defined packages panel and activate the +Add button.
|
|
Opens the Console dialog window for checking the log output and reporting problems to support@pmod.com. |
|
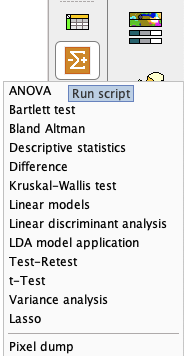
Shortcut for opening the scripts selection. System scripts are listed first, followed by scripts which were saved as plugins.
|
|
Opens the aggregation window for compiling individual statistics into an aggregate table. |
