Loading of Data into the R Console
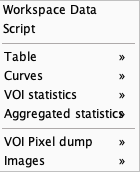
The ![]() button in the lateral taskbar with the sub-menu
button in the lateral taskbar with the sub-menu

allows loading the different types of data which are accepted by the R console.
▪A saved R workspace containing the (Workspace Data, .RData file).
▪R processing scripts (Script, .r file).
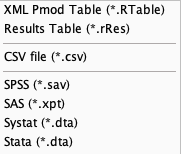
▪Tables saved from R (Table, .RTable file) or several statistics programs.

▪PMOD VOI statistics data (Statistics, .voistat file). The Enhanced output format and Enhanced aggregation format should be enabled in the configuration. Note that the statistics may included a time dimension if the image file was dynamic.
▪Aggregated PMOD results (Aggregated, .dbTab file) from multiple result files. Typically, the results of a population (controls, patients) or a condition (test, retest) should be compiled into a single aggregate.
▪Dumps of the pixel values within VOIs: VOI Pixle dump (.pixDump file);
▪Images in any of the supported formats. At this time, however, no dedicated statistics on images are yet provided through the PMOD R console.
Transfer of Statistics to R
The Go to R button in the statistics viewer or aggregate viewer transfers the data of all open statistics to the R server, generating one R variable per tab in the R workspace. Per default, the variables are labeled sequentially in the order of the tabs as g1, g2, .. etc, but explicit names can also be specified.
Note: The NaN entries in the statistics viewer or aggregate viewer are transfered when the statistics are sent to the R console.