The Histogram mode analyzes the distribution of pixel values in the VOI by sorting them into a number of value ranges (bins) with equal width. The bin width is obtained by dividing the overall value range by the Number of bars. There are three options for defining the overall value range:
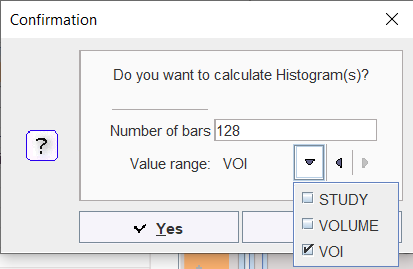
STUDY uses the min/max values of the entire data set, VOLUME the min/max of the current frame, and VOI the min/max of all pixels enclosed by a VOI. The appearing statistics viewer window represents the VOI histograms as curves with the mid-value of the bin on the x-axis, and the number of pixels with values in the bin range on the y-axis.
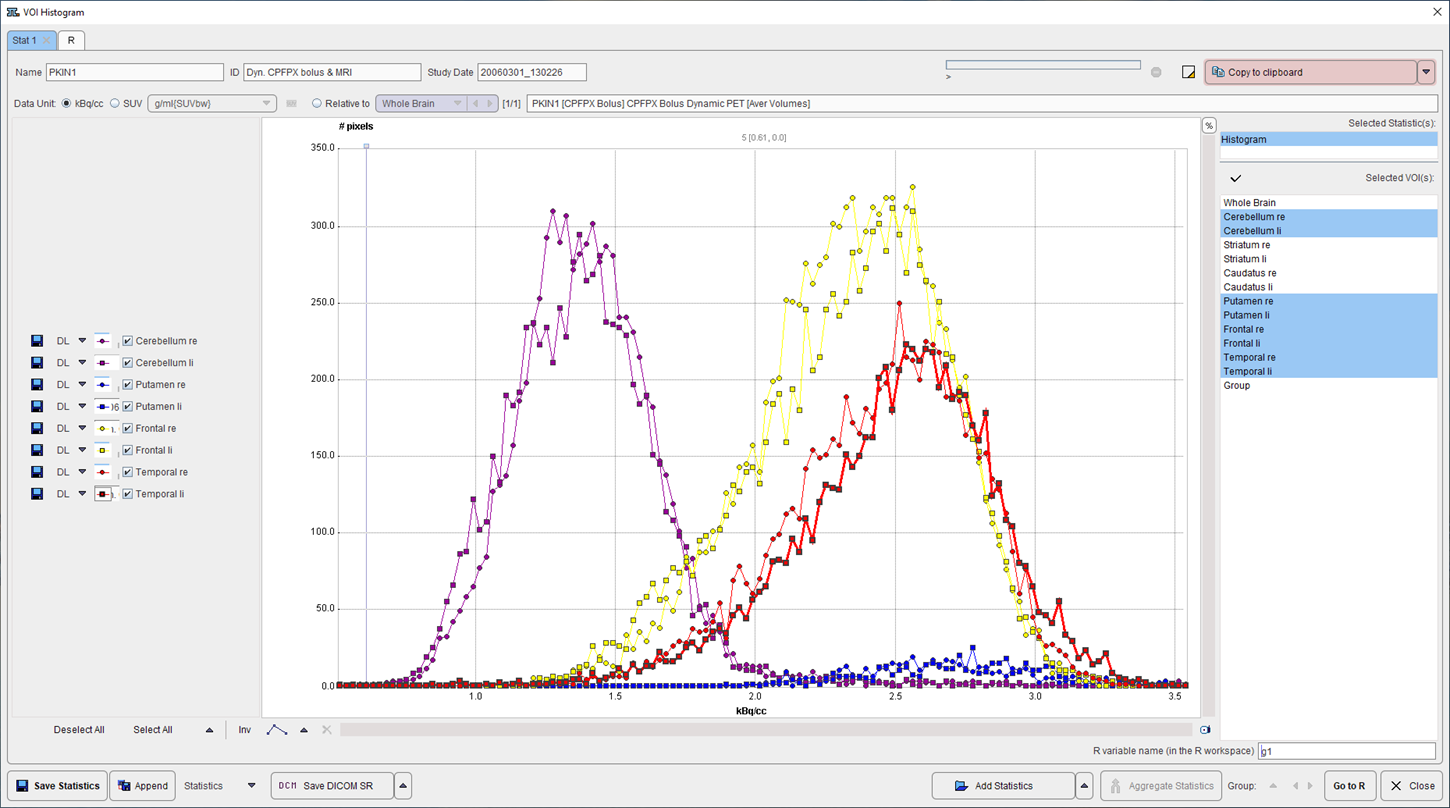
The histograms can be saved and exported in various ways, as statistics or curves.