A tabulated output of the weights by VOI and statistic (according to Image reduction options) is available following training with the Classification SVM architecture.
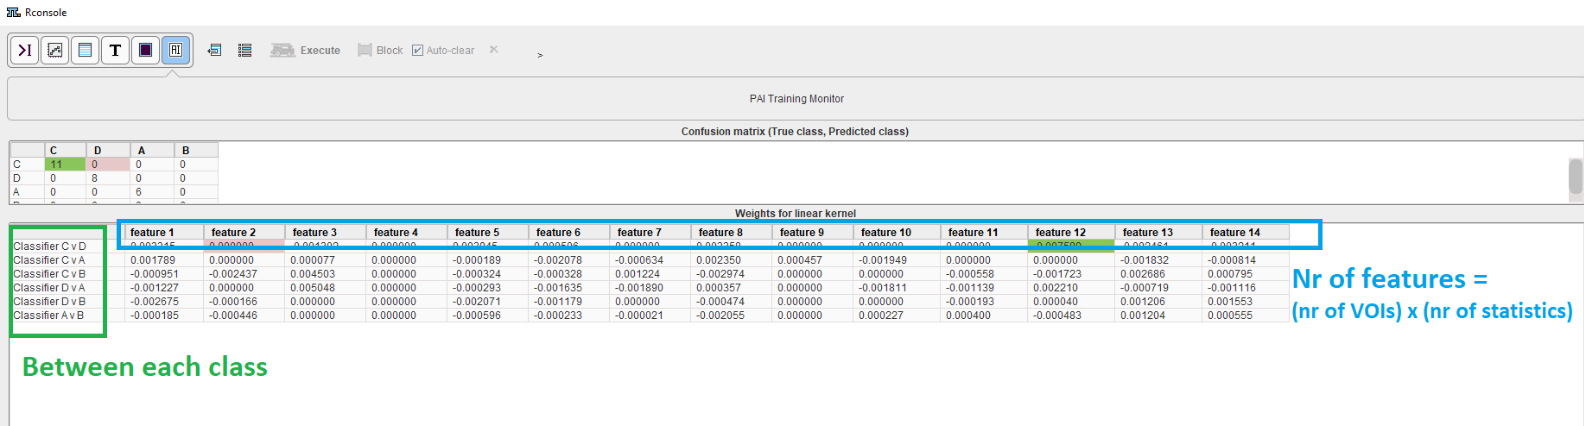
The confusion matrix is available for each SVM kernel.
For linear kernel a table of weights is available:
PAI uses the SVC variant of SVM.
SVC implements the “one-versus-one” approach for multi-class classification. In total, n_classes * (n_classes - 1) / 2 classifiers are constructed and each one trains data from two classes. (https://scikit-learn.org/stable/modules/svm.html )
For example, when we have 4 different classes: 4*(4-3)/2 = 6.
The bigger an absolute value in a given row of the table, the more this feature distinguishes between the 2 classes.
For example for 2 VOIs and 3 statistics we have 6 features:
Feature 1 corresponds to VOI1, stats 1.
Feature 2 corresponds to VOI1, stats 2
Feature 3 corresponds to VOI1, stats 3
Feature 4 corresponds to VOI2, stats 1
Feature 4 corresponds to VOI2, stats 2
Feature 4 corresponds to VOI2, stats 3.