PERCIST Report Generation
Once the lesion VOIs are properly named and sorted, a report can be generated with the PERCIST button in the lower right.
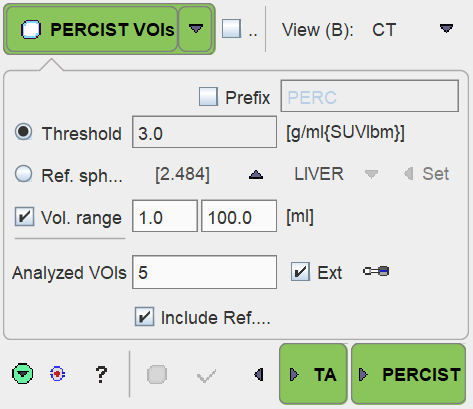
The number in the Report VOIs field determines how many of the VOIs from the list top down are evaluated. Entering a value of 0 has the effect that all VOIs are included. If Include Ref. VOI is checked, the reference sphere statistics are included in the report, which may give relevant information about the background in longitudinal scans.
If the Ext field is checked, selected shape and Texture Analysis results can also be included in the report. This content is configured as illustrated below.
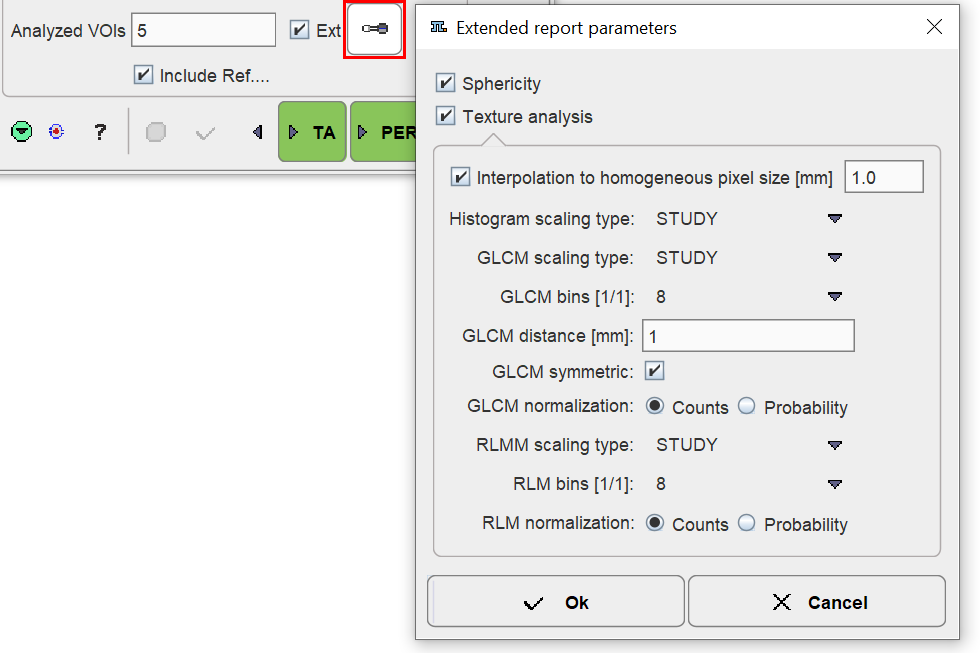
PERCIST Report Content
The results are shown on the dedicated PERCIST Report page.
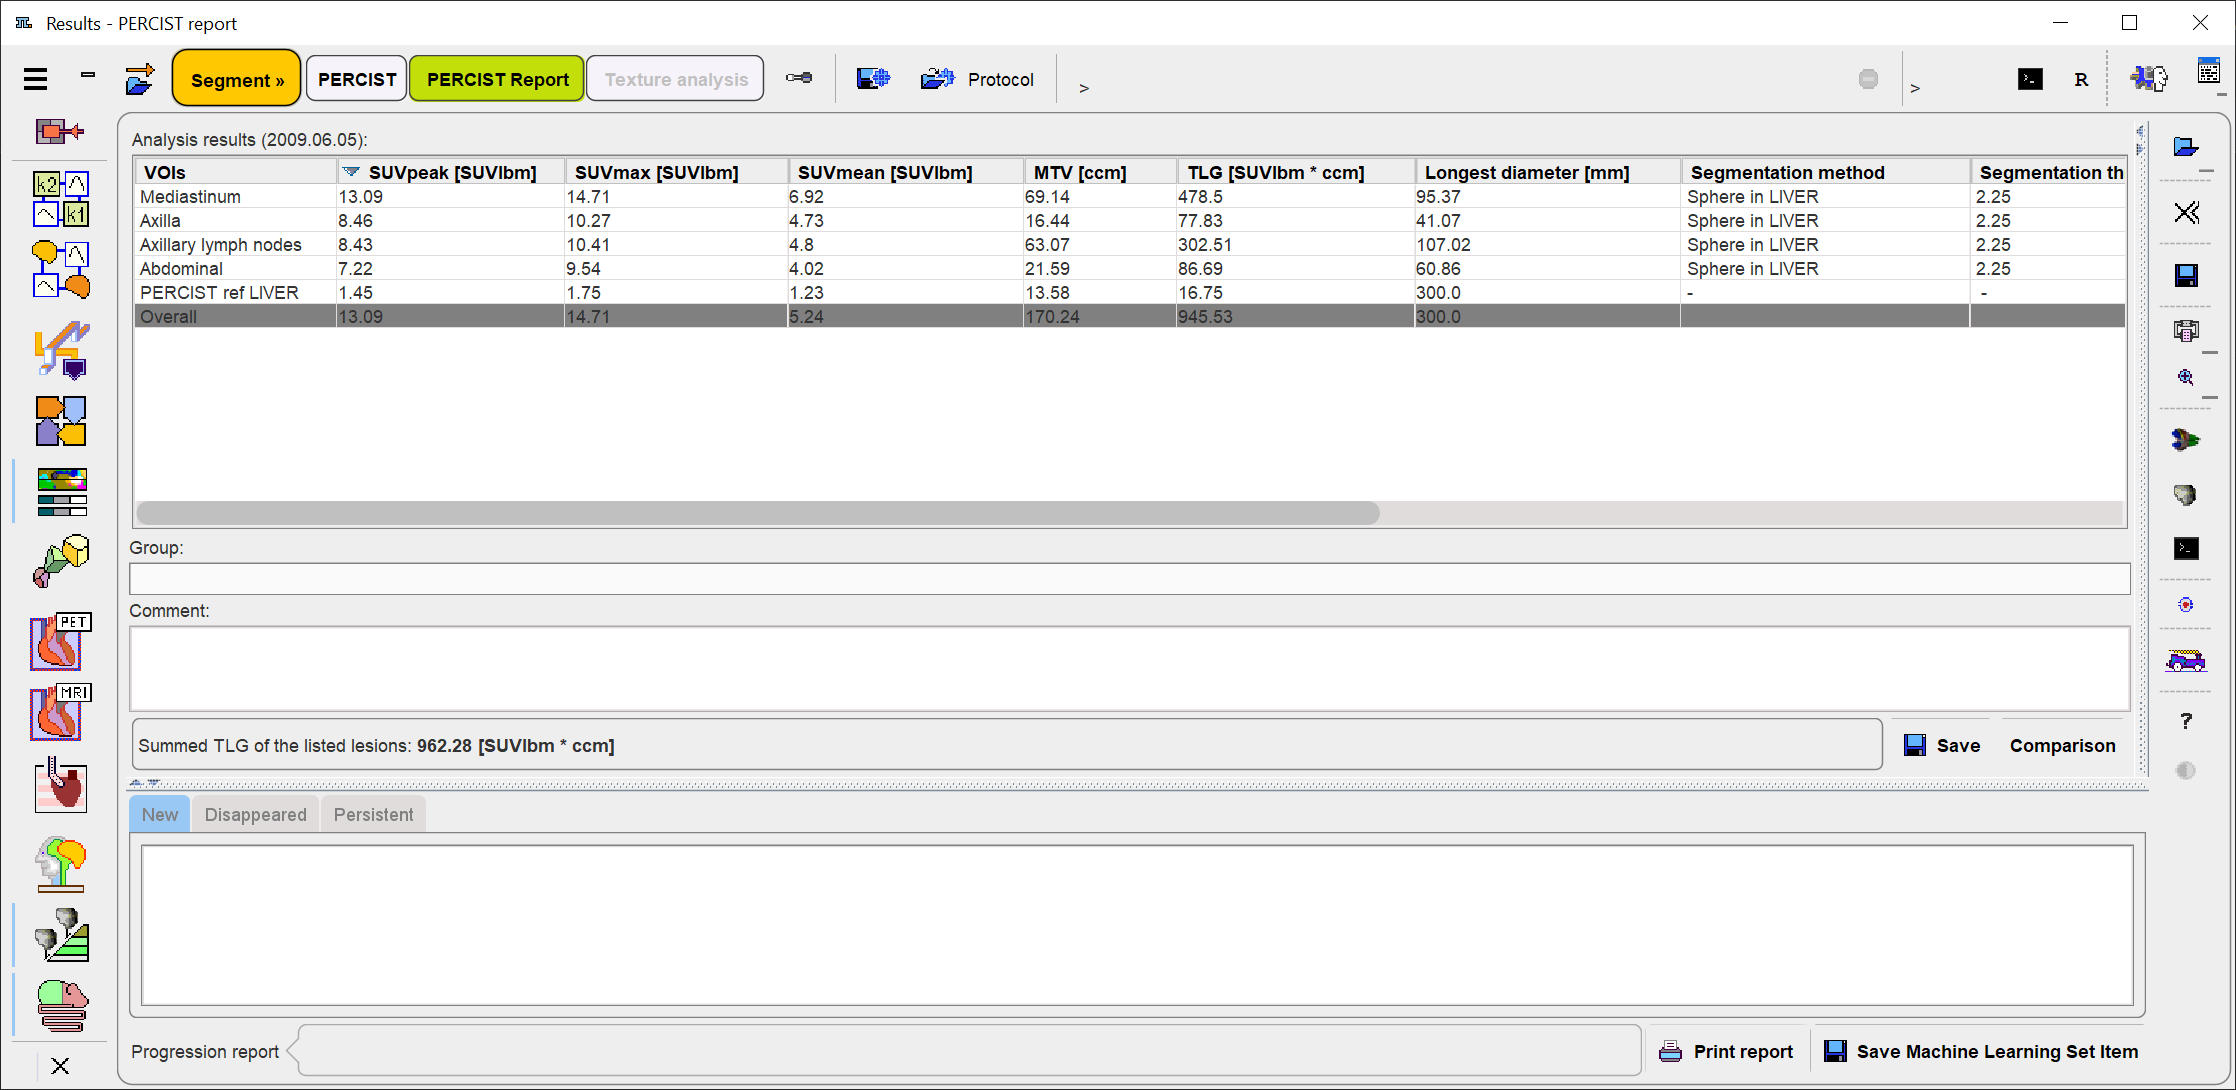
The Analysis results sections lists the specified number of lesions with the relevant measures in the columns. Note that the list is sortable by clicking into the column headers. In addition to SUVpeak, SUVmax, SUVmean, MTV, TLG, and Longest diameter there are columns with information about the segmentation method and the VOI location.

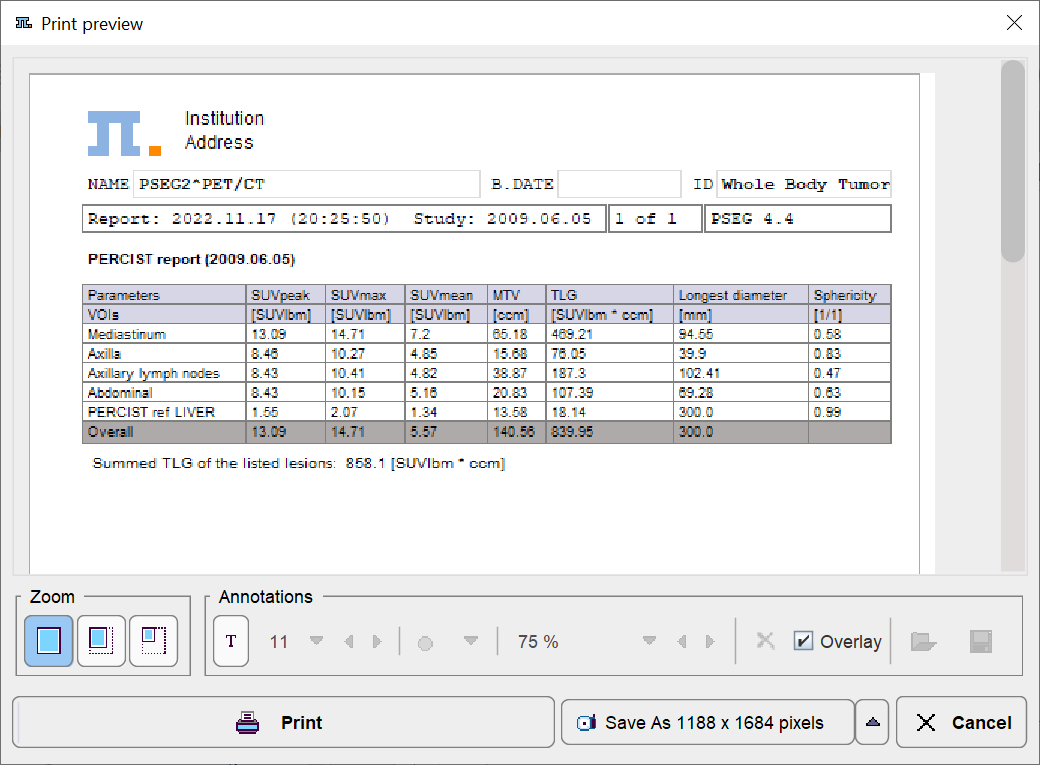
The Group and Comment text fields are intended for documentation purposes. If the image has been loaded from a PMOD database which already contained a group definition and comments for the image, this information is automatically copied into the corresponding fields. The Save button stores the information shown to a text file for longitudinal comparison. Print report opens a dialog window showing the list contents in the standard PMOD report printing environment.
Result Comparison
The PERCIST Report page can show two results in parallel. For a longitudinal comparison please activate the Comparison button. Consequently, the window is split into two areas with the current results to the left.
To the right use the Load button for retrieving the result of the prior analysis. Two strategies can be applied to order and link the lesions. Per default the Pair by VOI Name tries to place entries with the same name in the same table row. In the example below the empty row in the table to the right indicates a lesion which has disappeared. The TLG column of the table to the left (current examination) shows an indication of the TLG change in fields colored according to the change (red = increase, green = decrease).
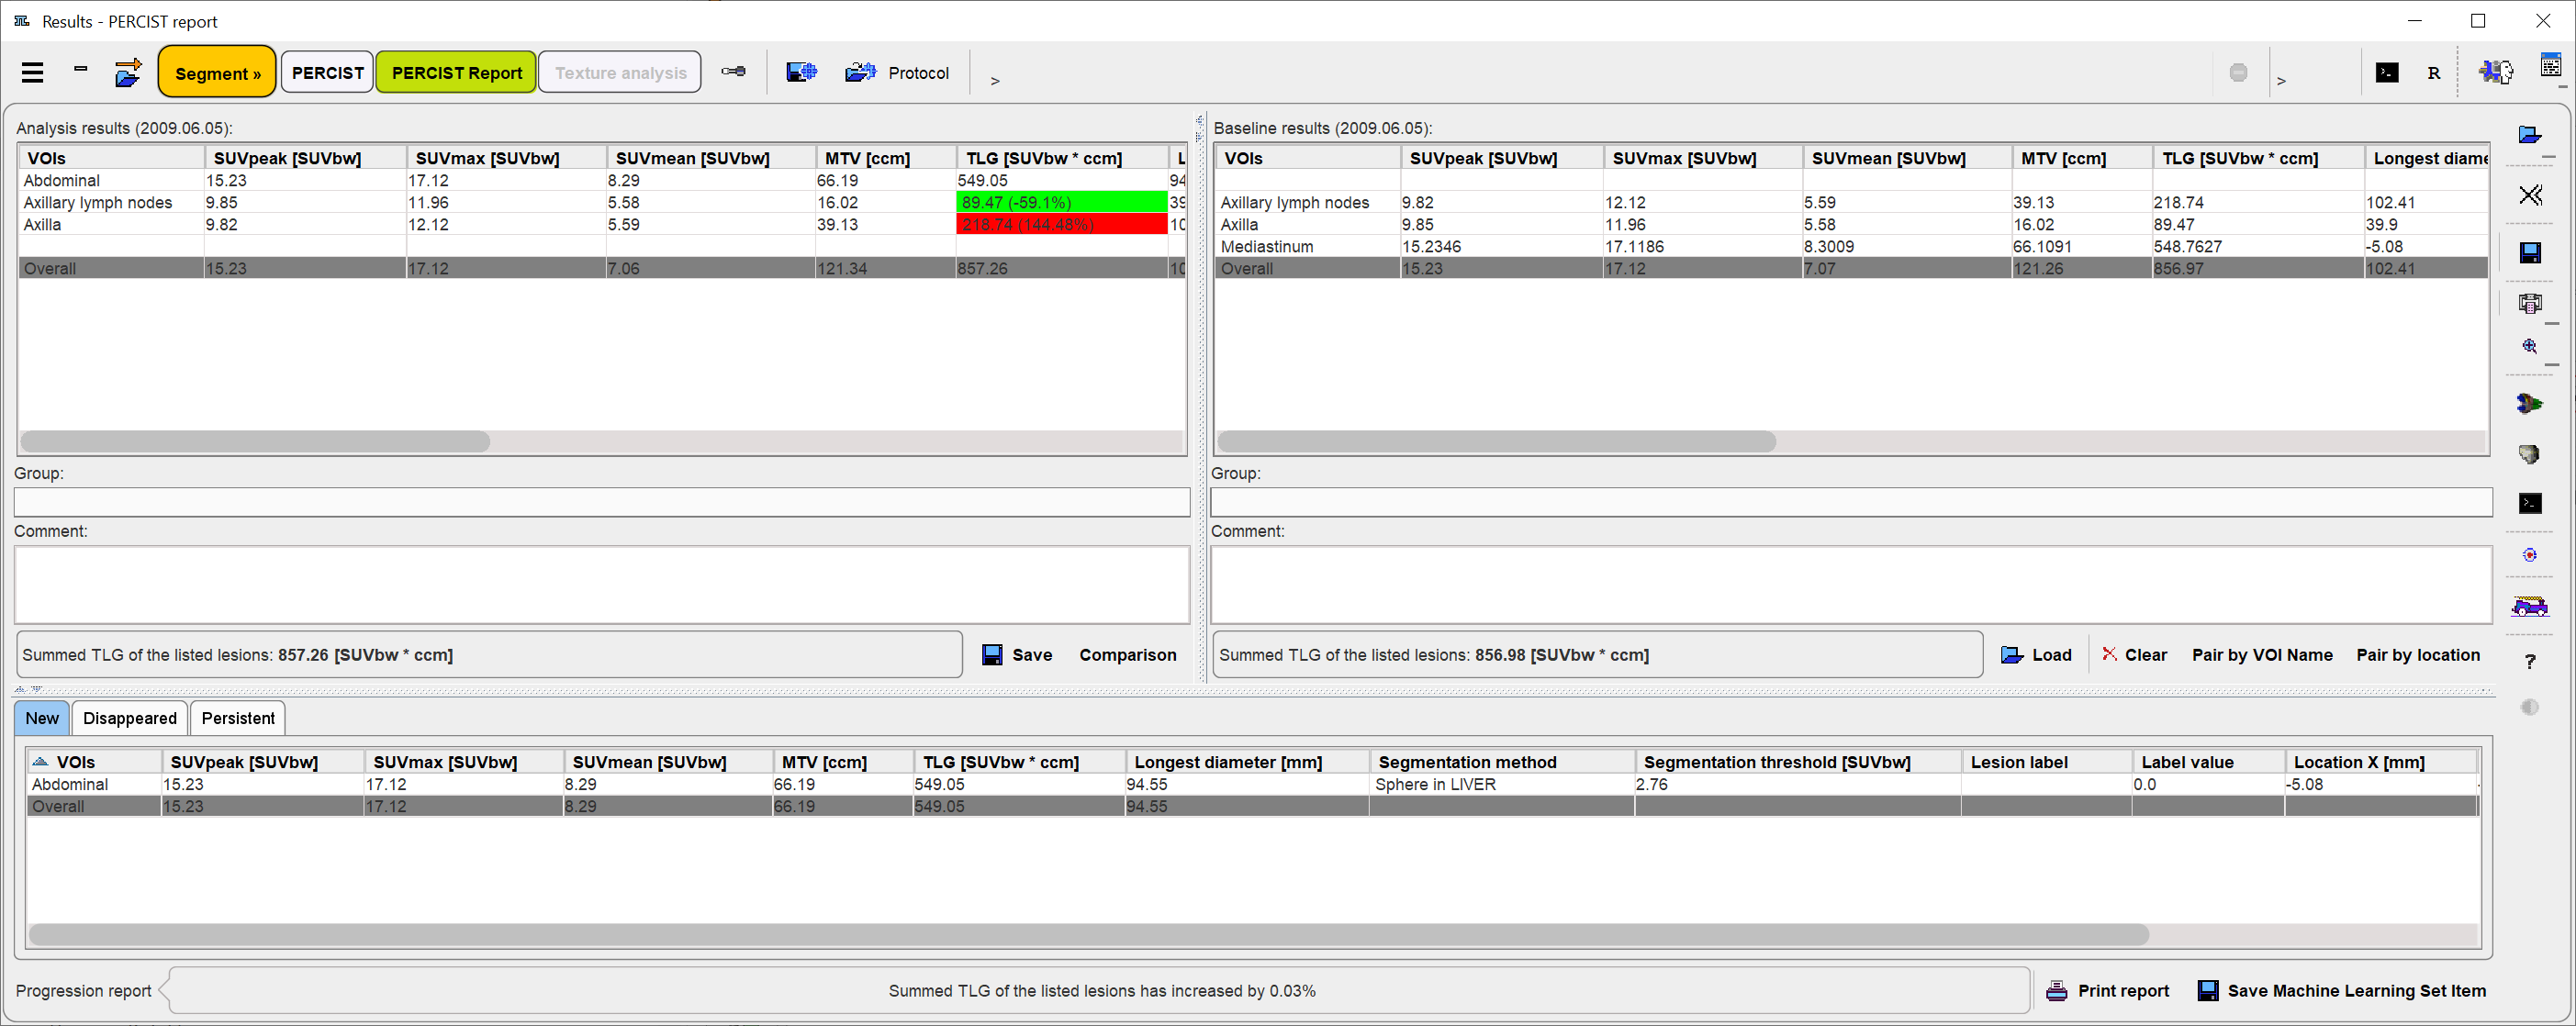
In the lower sections there are three additional tabs for listing New, Disappeared and Persistent lesions separately. The latter provides a comparison of the uptake measures between the two examinations. In this situation Print Report will produce three report pages, one for each of the analysis results, and a comparison page.

Pair by location employs the VOI centers for aligning the entries in the upper comparison table, but does not have an effect on the comparison tables.
Note: Consistent naming of the lesions is crucial for the longitudinal comparison.