The methodology of the N30R83 maximum probability atlas used in PNEURO is described in detail in the publication by Hammers et al. [3]. The number of subjects in this paper was limited to 20 healthy subjects and 49 brain structures. The population and the number of covered structures was extended in a follow-up study by Gousias et al. [4] to include a total of 30 subjects and 83 brain structures, yielding the current N30R83 atlas. Population: 15 mal, 15 female, median age 31 years (range: 20-54), 25 of the 30 subjects strongly right handed.
Brief summary of the methodology used to construct the N30R83 atlas:
▪A T1-weighted anatomical MR image was acquired for every subject.
▪For each MR image, the brain structures were manually outlined in consensus by two neuroanatomically trained operators.
▪Each of the 83 brain structures was assigned a unique integer which was used as a label for all pixels belonging to a structure.
▪The results of the outlining and the labeling were 30 individual label atlases in the native spaces of the subject MRIs.
▪For each MRI, the stereotactic normalization to the MNI T1-MRI template was calculated and applied to the individual atlases for transforming them into the MNI space. Nearest-neighbor interpolation was a used to maintain unique label information.
▪These normalizations resulted in 30 atlases representing the individual anatomies in the MNI space.
▪For each pixel in the MNI brain mask the label statistics across the 30 individual atlases was calculated. The most frequent label was selected for creating the maximum probability atlas. If several labels had the same maximal frequency, the selection among them was random.
▪This statistical analysis resulted in the N30R83 atlas in the MNI space which contains for every pixel a unique label number, corresponding to one of the 83 brain structures.
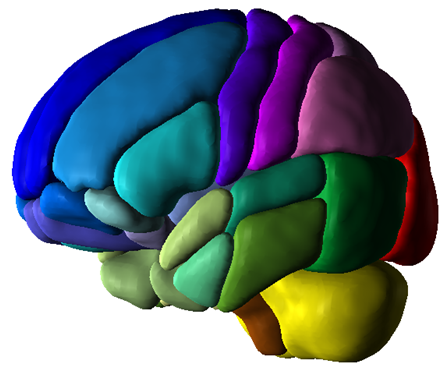
The illustration below shows a smoothed 3D surface rendering the 83 brain structures of the N30R83 atlas. It is clearly notable that the contours are not restricted to the gray matter pixels.
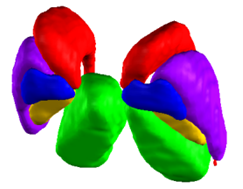
The deep nuclei N30R83 structures are illustrated below.
Note that there are two variants of the atlas available, with 2mm and 1mm sampling. For data with resolution below 2mm it is recommended using the 1mm variant to take advantage of the smoother anatomical definition.