The logistic regression is providing the linear fit to the log odds using the linear discriminant function, i.e. the linear combination of the predictors and the corresponding set of the regression coefficients that are specific to the model but the same for all test cases. To convert it into the probability value the following logistic function is used [11]:
![]() :
:
The ![]() is the probability p of the test data set to belong to the stable MCI group. As only two groups are being analyzed, the probability to belong to the other group is then 1-p. The cut-off value for p is 0.5.
is the probability p of the test data set to belong to the stable MCI group. As only two groups are being analyzed, the probability to belong to the other group is then 1-p. The cut-off value for p is 0.5.
As an example, the linear discriminant function is applied to two individual test cases available in the Pmod database as a workspace: TestCases_LDA.RData. The AAL VOIs statistics information of the two subjects is available in the workspace as two variables: g1 and g2. Use the Load/Workspace entry from the lateral taskbar to load the TestCases_LDA.RData in the Pmod-R interface.
Note: The discriminat model can be applied to VOIs statistics or to aggregated files.
The prediction script requires the linear discriminant function to be available. Load in appending mode the Function_LDA.RData workspace available in the Pmod example database. This workspace contains the LDA function.
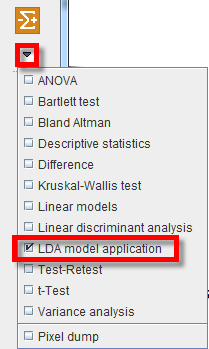
To start the analysis please select the LDA model application entry in the scripts list:
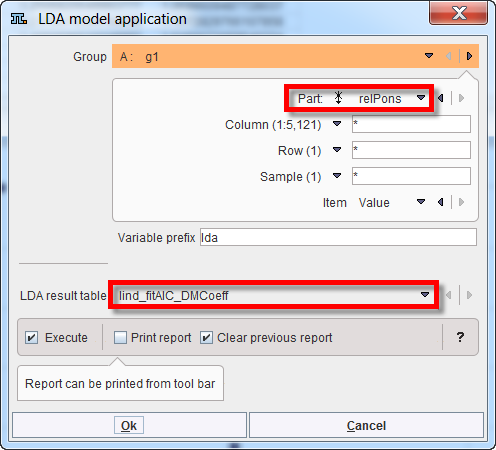
The prediction is run first for the g1 variable in the workspace. Therefore the g1 variable is selected in the dialog window as Group. The relPons statistics is representing the VOIs statistics relative to Pons and is set as Part. The lind_fitAIC_DMCoeff is set as the LDA result table.
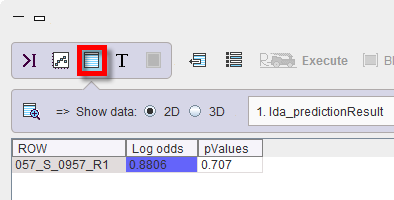
The results are accessible in the Table layout:
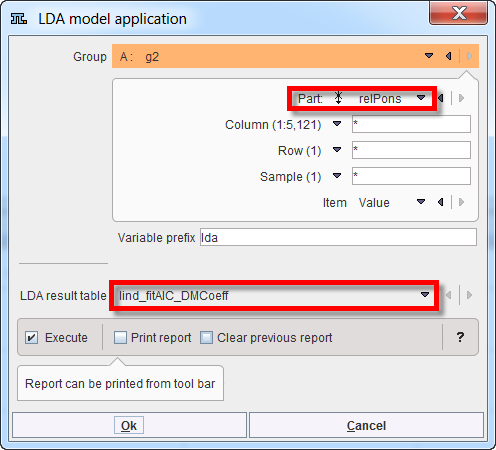
The prediction is run for the g2 variable using the same settings in the interface:
and the results are shown below:
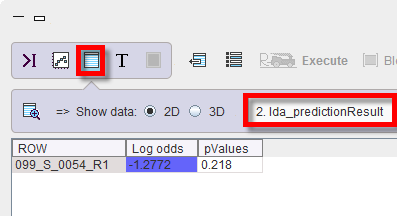
The first column in the prediction tables are representing the subject ID while the second and the third columns are listing the log odds and the probability value respectively.
Particularly, the test case with log odds results in the positive range and a prediction value of p > 0.5 most likely is representing a stable MCI subject. The test case with negative log odds results and a p < 0.5 is indicating a MCI subject most likely belonging to the MCI group which will progress to dementia.