The PMOD tools are docked, reducing the number of windows used in the analysis workflows:
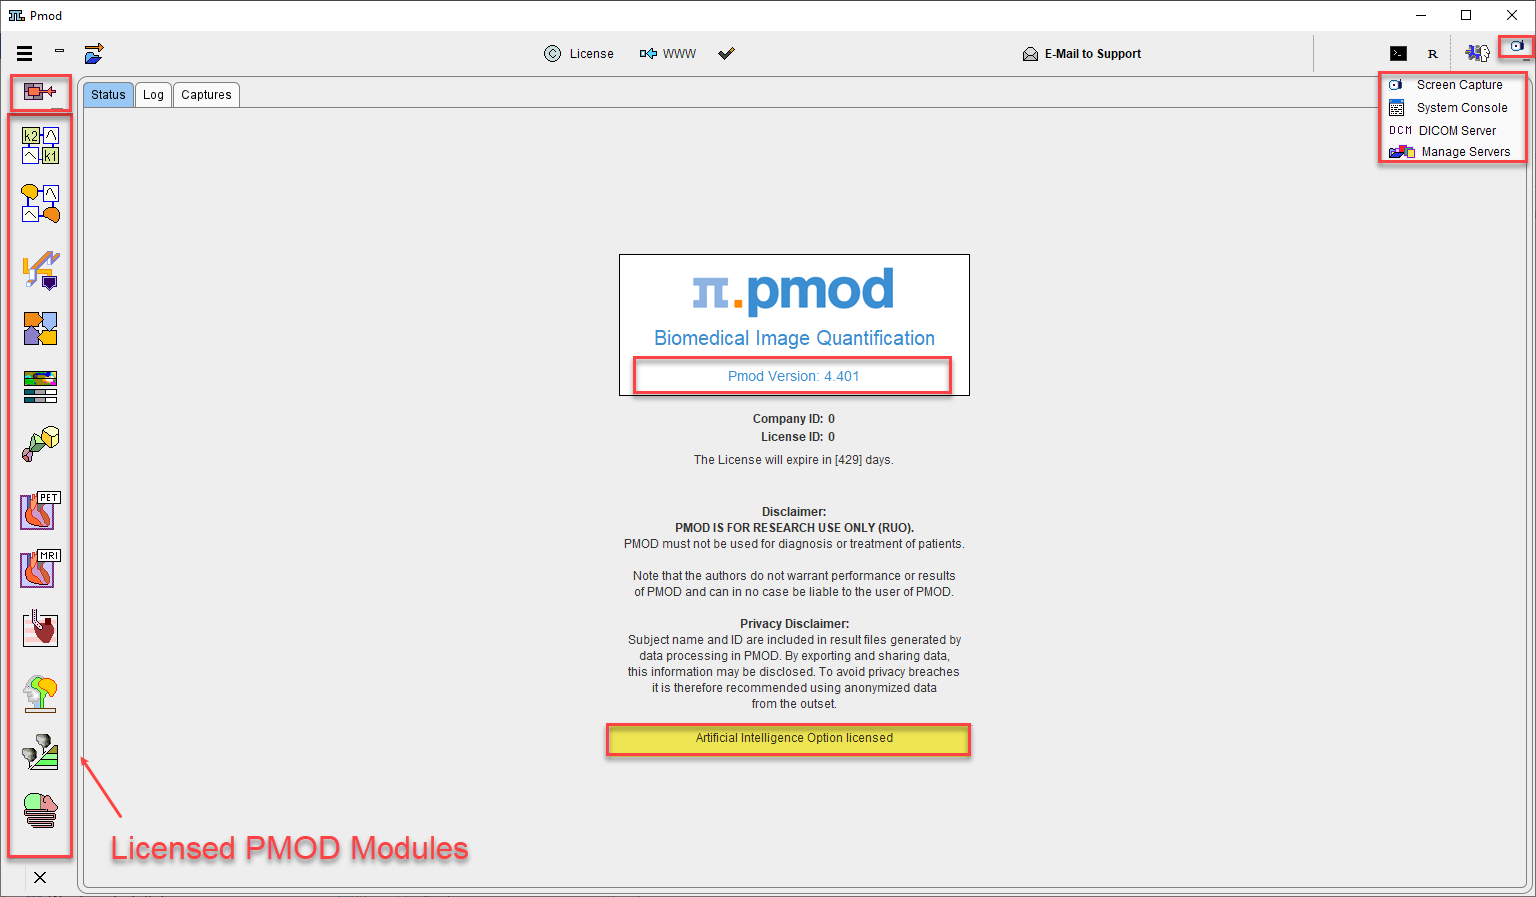
When the Pmod Artificial Intelligence (PAI) module has been licensed, an indication appears on the Status tab at the bottom of the page as highlighted in the capture above.
The PAI functionality is currently available in PVIEW, PSEG, PCARDM and PNEURO.
There are various buttons on the top line in the docking interface that are common for all modules. Their functionality is described in the table below:
|
Allows showing/hiding the modules available for selection in the docking interface |
|
Allows minimizing/maximizing the dock window |
|
Allows accessing the unified data loader, the new PMOD Scientific Data Management System |
|
Starts the Pipeline Batch interface. |
|
Starts the PMOD R console |
|
Allows accessing the PMOD Configuration and Users Settings |
|
Allows sending by email the log content and/or the screen captures to the PMOD helpdesk. The functionality is described in details in the Problem Reporting section. |
The selection buttons available in the upper right corner of the docking interface are related to the different PMOD functionalities.
|
Allows adding a capture of the entire screen (not only of the active window) to the Console Buffer |
|
Allows accessing the content of the system console. |
|
Starts the DICOM server using the configuration of the current user. If it is already running, the configuration is shown. A blue background color indicates ongoing server activity, e.g. the receiving of images. |
|
Starts the database administration window. If the Transaction Server is already running, an information window is shown which describes the server status. A blue background color indicates ongoing server activity. |
Note: The number of the tools buttons in the Dock depends on the configuration that was purchased. Only the base functionality View is always present.
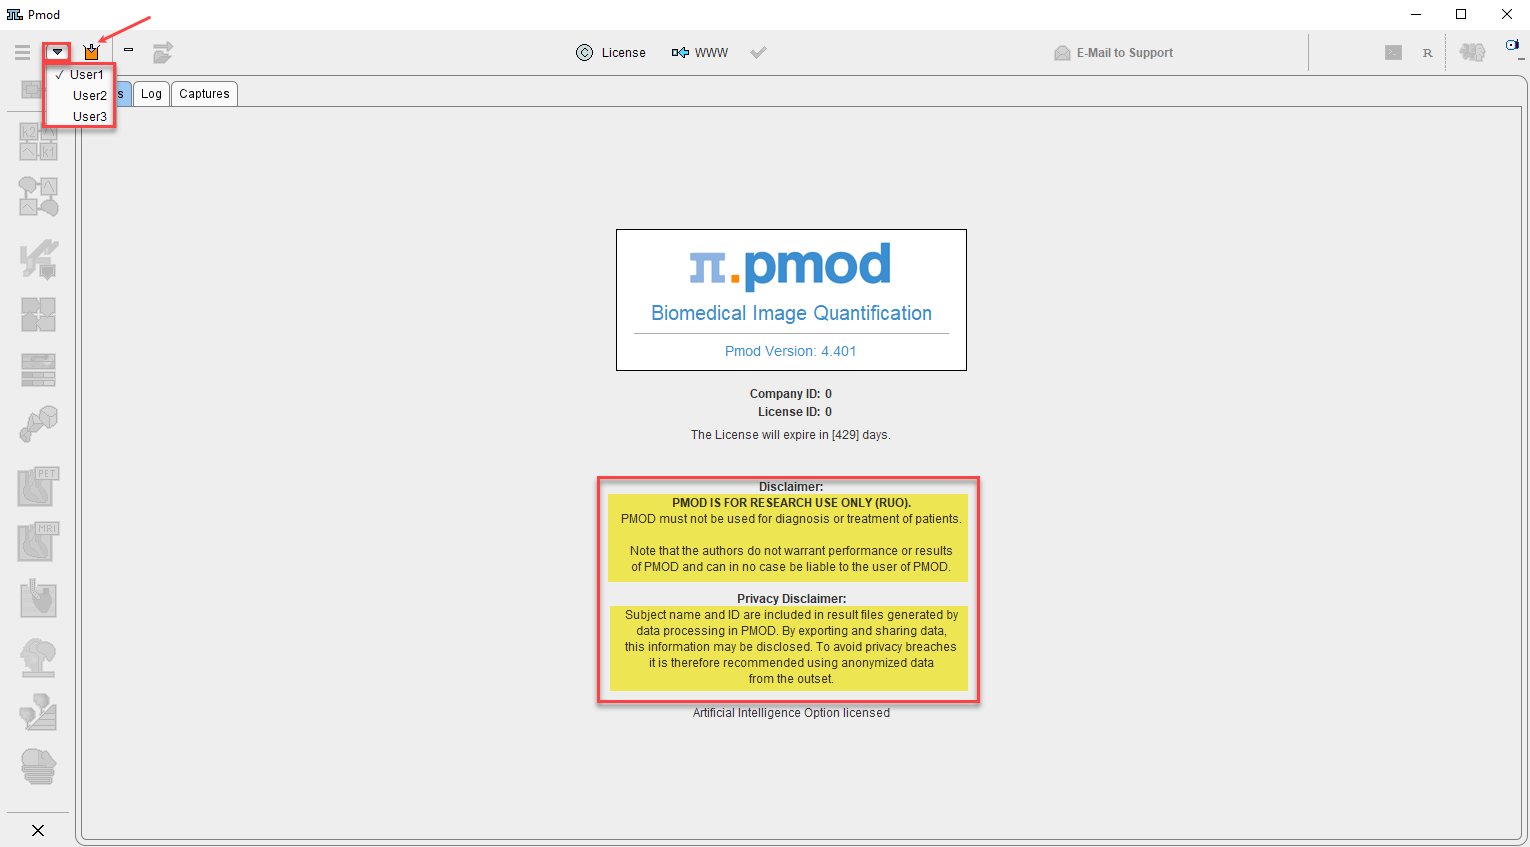
If multiple users have been configured, one of them needs to be selected and the login ![]() button activated. Otherwise, the login procedure proceeds automatically. Note the startup window which reminds you that PMOD is a research software and shows license-related information.
button activated. Otherwise, the login procedure proceeds automatically. Note the startup window which reminds you that PMOD is a research software and shows license-related information.
After the login, the tool buttons are active and you can start working with PMOD.
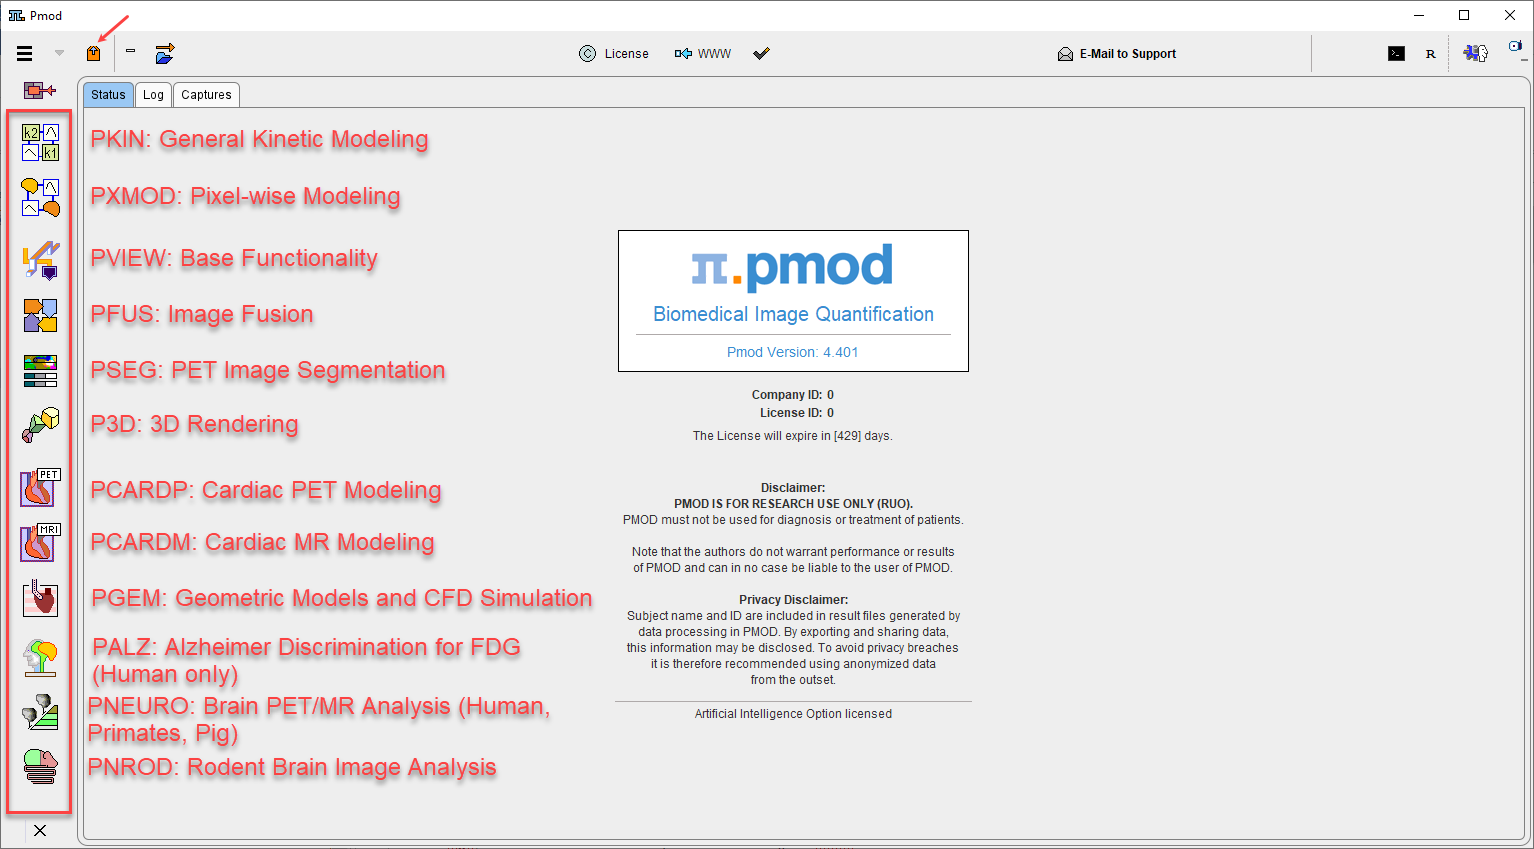
The Dock interface allows starting the different tools by activating the dedicated buttons. Alternatively, you can directly drag appropriate files (image files, or .km modeling files) onto the buttons.
The ![]() button present on the top of the tools buttons allows accessing the PSAMPLE Acquisition and Correction modules used with the Twilite Blood sampling system.
button present on the top of the tools buttons allows accessing the PSAMPLE Acquisition and Correction modules used with the Twilite Blood sampling system.
Starting PMOD Tools from the Command Line with Data
In some situations it is an advantage when a single tool is started rather than first opening the ToolBox. An example is a user program such as IRW which wants to open a PMOD tool with specific data.
This can be done by adding to the system-specific startup script the name of the tool and the file names of the data to be loaded. The Windows example below
cd /Pmod4.4
./java/jre/bin/java -Xmx1200M -jar pmod.jar PFUS C:/DICOM/20060815/38243299/00000210 C:/DICOM/20060815/38243299/00000888
starts the fusion tool (PFUS) and loads two DICOM series. The first is loaded as the reference series, the second (and following) as the reslice series. Note that it is sufficient to specify a single file even if a DICOM series consists of multiple files. The loader will find and load all images belonging to the series.
When using several users, the user to be logged in can be specified with an additional command line option -user[n], where n indicates the user, numbered from 1.
PMOD Status
The icon in the top line indicated in the capture below provides status information about the state of PMOD operation. A check indicates proper operation, whereas colored bullets alert the availability of an update (green down arrow) or some malfunction (red). Activating the icon displays the status window as illustrated below.
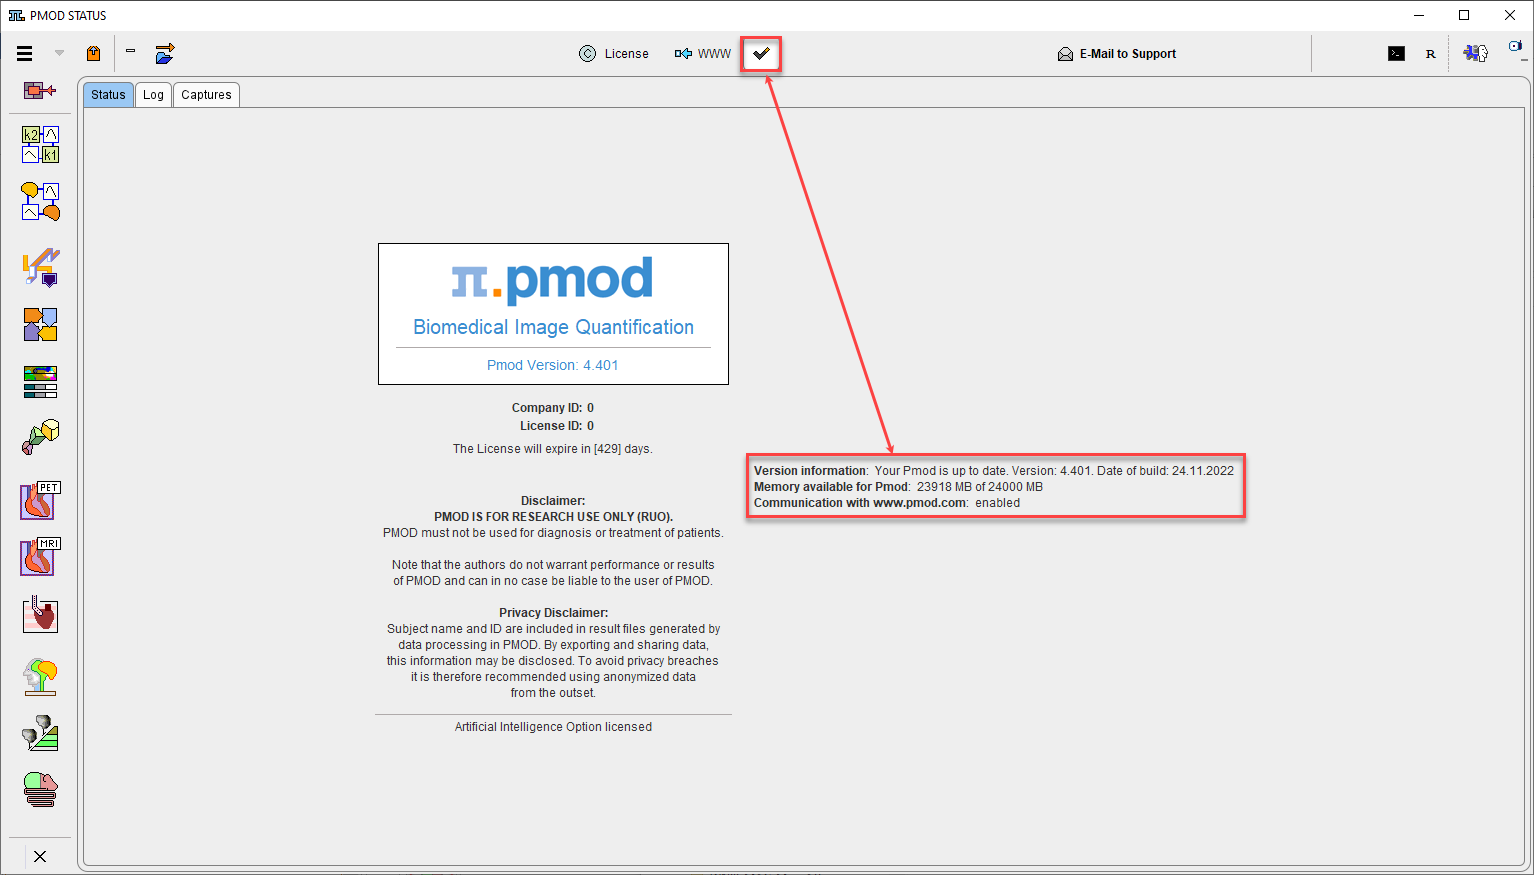
The green down arrow indicates that a new PMOD version or build is available for download. This functionality is active only when the communication with the www.pmod.com is enabled.
The customers with active maintenance agreement or customers that purchased version 4.3 are entitled to free PMOD 4.4 upgrade.
The customers who UPGRADED to version 4.3 or earlier versions are NOT entitled to free upgrade to 4.4. Purchase of 4.4 is required.
Notes:
The version checking procedure may not work properly behind institutional firewalls. In that case, it can be switched off to avoid the warning icon.
New builds of the current PMOD version are uploaded at irregular intervals, mainly to fix bugs. We therefore recommend using the latest build of a version.
All the builds within a PMOD version are freely accessible when access to the main version was purchased.