Variance Analysis is a convenience script for comparing three or four groups. It first applies the Bartlett test to establish, whether the group variances are equal. If yes, it proposes one-way ANOVA for testing for significant differences between the group means. Otherwise, the non-parametric Kruskal-Wallis test is proposed for testing whether the distributions are identical.
Variance Analysis Configuration
The Variance Analysis configuration window is illustrated below.
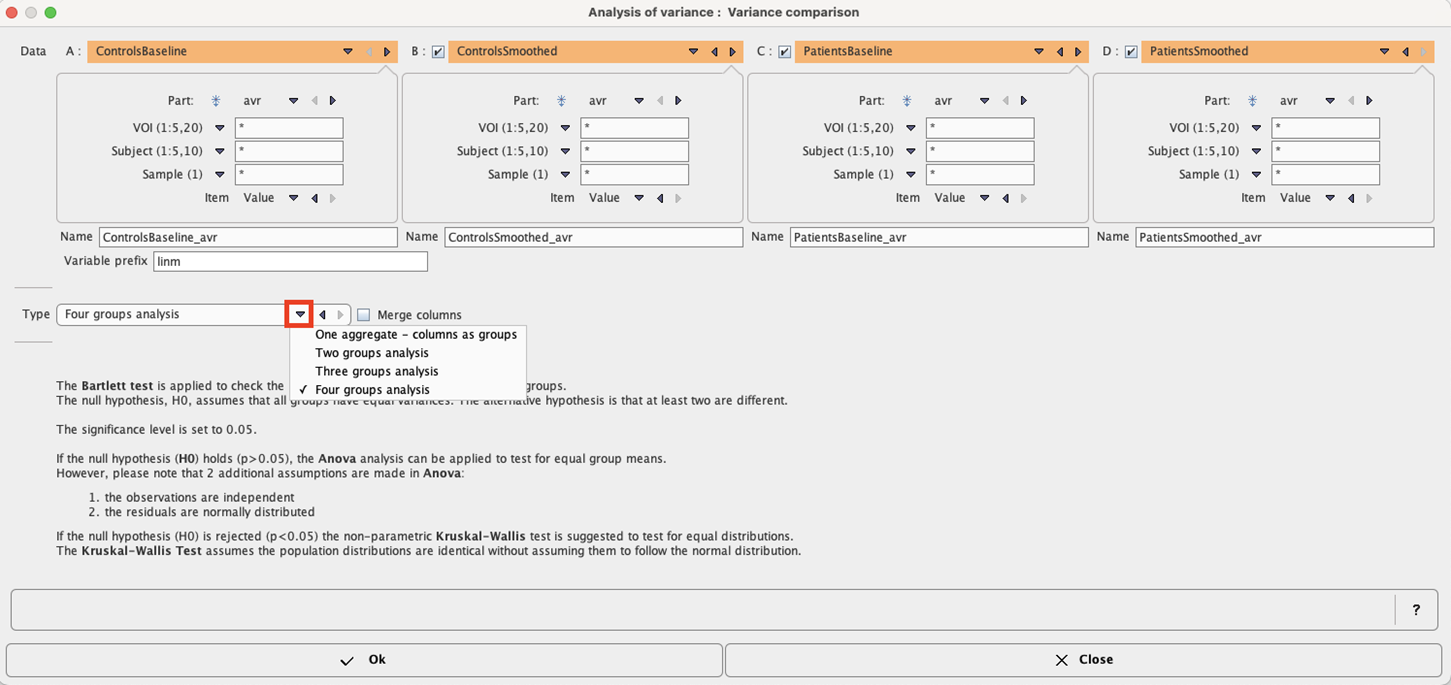
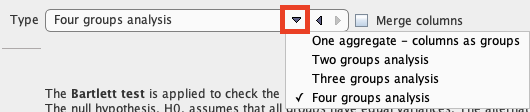
Up to four groups can be compared, according to the Type selection
If Merge columns is enabled, the data of all columns will be pooled, otherwise the test is performed between the respective columns of the aggregates.
With the One aggregate - columns as groups setting it is assumed that the groups to be compared are arranged as columns in a single aggregate.
Variance Analysis Results
As a first step, the Bartlett Test is applied for comparing the variances, and the result shown.
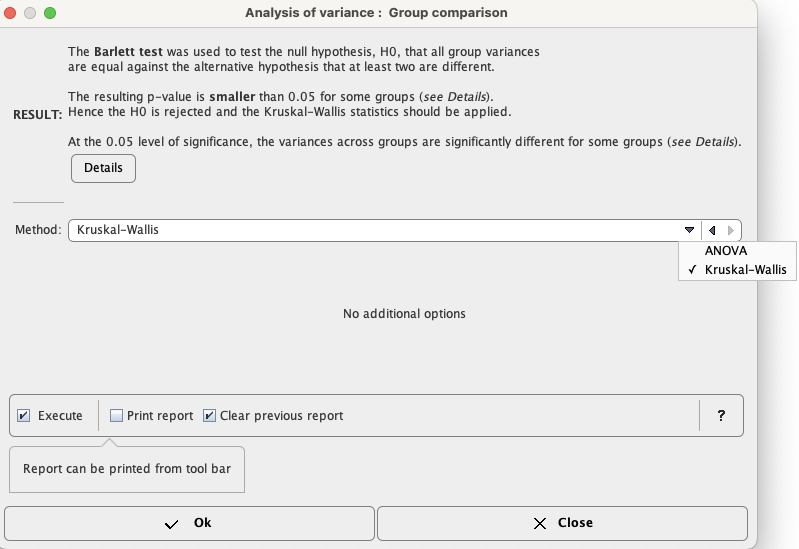
Depending on the outcome, ANOVA or Kruskal-Wallis are proposed as the follow-up test, but both are available. When applying either test as the second step, the results correspond to that of the individual test.