Principle of Reference Models
The measurement and analysis of the blood samples for kinetic modeling is an invasive and demanding procedure. Therefore, methods have been developed to obviate the need for invasive blood sampling. The solutions found replace the arterial input curve by an indirect input curve, namely the time activity curve of some reference tissue. Therefore they are called reference methods. Reference methods are not able to provide a full kinetic analysis. However, assuming certain relations between the kinetics of the tissue of interest and the reference tissue, they can provide valuable measures of interest.
Model Structure
Most of the reference methods are dedicated to reversibly binding neuroreceptor tracers. A reference tissue must be found which is devoid of receptors, and then it is assumed that the distribution volume of the non-displaceable compartment (free tracer in tissue and non-specific binding) is the same among the tissues. Under these assumptions a measure of the receptor concentration called binding potential (BP) can be calculated from the two time-activity curves.
The reference methods differ in their mathematical approaches, and they show substantial differences with regard to noise sensitivity and processing speed. They are described in the following sections. The compartment models are based upon the following configuration:
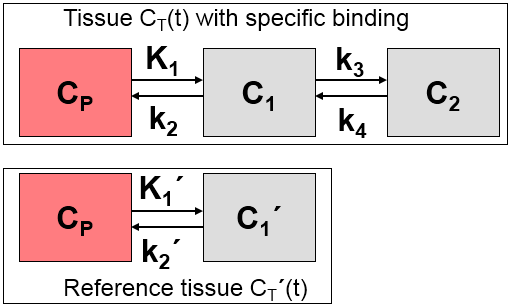
In the model equations C'(t) represents the TAC from the reference region (k3=0 in the 2-tissue compartment model), and C(t) the TAC from a receptor-rich region (k3>0).
PXMOD Implementations
The measurements required for the reference methods are a dynamic PET or SPECT acquisition and as a crucial element the TAC of suitable reference tissue (e.g. frontal cortex for D2 receptors).
Optionally, the model can be tested with a target tissue TAC, resulting in a visualization of the fit. This fit may additionally serve for estimation of an equilibration time t* and/or tracer clearance k2' from reference tissue. If the fit is not satisfactory, the user may change some of the model parameters and try the fit again.
For models which require k2' as an input various methods of getting an adequate value are supported.
The pixelwise calculations result in BP maps. To avoid meaningless outliers which compromise the display it is recommended to restrict the accepted BP values to a reasonable range.