The Simplified Reference Tissue Model (SRTM) of Lammertsma and Hume [1] is used for the analysis of studies with reversibly binding neuroreceptor tracers. A reference tissue devoid of receptors is required which can be modeled by a single-tissue compartment model.
The assumptions of the model are:
1.The distribution volume is the same for the tissue of interest and the reference tissue: K1/k2=K1'/k2'.
2.The kinetics in the receptor-rich tissue of interest is such that it is difficult to distinguish between the specific and the non-displaceable compartment; ie. the tissue TAC can be fitted by a 1-tissue compartment model with an uptake rate constant k2a = k2/(1+BPND). Note that this assumption may not be valid for all tracers, and in this case SRTM calculates biased BPND estimates.
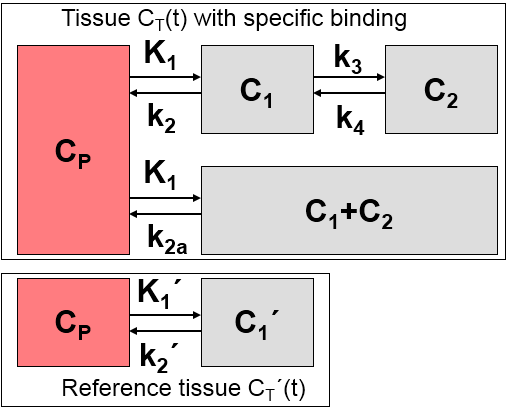
Defining the ratio of tracer delivery R1 as K1/K1' and the binding potential BPND as k3/k4, the following operational equation can be derived for the measured tissue TAC in a receptor-rich region:
![]()
For convolution with the exponentials, the reference tissue TAC C'(t) is resampled on a regular grid, which can be specified by the Resampling parameter.
Gunn et al [2] transformed the SRTM model into a solution which is better suited for pixelwise application. It is based on a set of basis functions which are generated by convolving the reference TAC with decaying exponentials. The exponents employed should cover a range which is reasonable for the tracer considered. To calculate the binding potential of a TAC a least squares fit is performed with each of the basis functions. That fit with minimal deviation between the TAC and the model curve is regarded as the solution, and the binding potential is calculated from the set of fit parameters.
The PXMOD implementation in the BPnd (SRTM Ref) model differs from that described in [2] by the following points
1.It is assumed that the dynamic PET images are decay corrected. Accordingly, there are no appropriate weights for the least squares fit, and unweighted fitting is employed.
2.The additional factorization Rm=QTgiven in [34] which is intended at improving speed has not been implemented. Rather, the linear least squares problem given by Eq. 4, is solved explicitly for each basis function at each voxel by means of a singular value decomposition (SVD). Hence, nx*ny*nz*nBasis SVD operations are performed, which may take substantial time.
3.The term k2a instead of theta3 is used. k2a=k2/(1+BPnd) represents the apparent k2.
Acquisition and Data Requirements
Image Data |
A dynamic PET data set with an neuroreceptor tracer which behaves kinetically similar to a 1-tissue compartment model. |
Target tissue |
Optional: TAC from a receptor-rich region (such as basal ganglia for D2 receptors). Only used for visualization of model fitting. |
Reference tissue |
Mandatory: TAC from a receptor-devoid region (such as cerebellum or frontal cortex for D2 receptors). Note: specification of an appropriate reference TAC is crucial for the result! |
Model Preprocessing
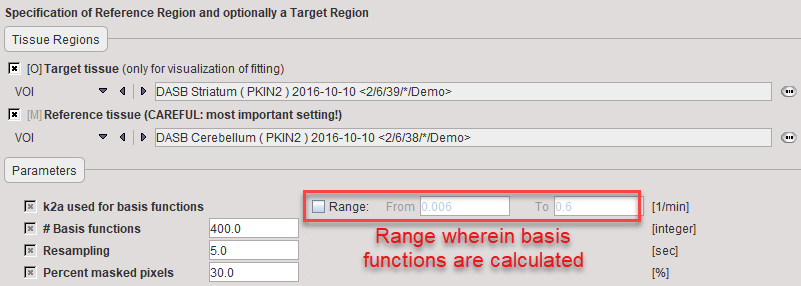
k2a used for basis functions |
Enter the minimal value of k2a (slowest decay of exponential) and the maximal value of k2a (fastest decay of exponential) after checking the Range box. |
# Basis functions |
Number of basis functions between the minima and maximal k2a. Note that increments are taken at logarithmic steps. This number is directly proportional to processing time. |
Resampling interval |
Specifies the interval of curve resampling which is required for performing the operation of exponential convolution. Resampling interval should be equal or smaller than the shortest frame duration. |
Percent masked pixels |
Exclude the specified percentage of pixels based on histogram analysis of integrated signal energy. Not applied in the presence of a defined mask. |
The result of a model fit during Model Preprocessing is shown in the Model Results panel for inspection. If no Target tissue is specified, the panel remains empty.

Model Configuration

BPnd |
Estimated binding potential (BPnd= k3/k4 according to the underlying model). |
k2 |
Estimated efflux rate constant k2. |
R1 |
Ratio of tracer delivery in each pixel relative to the reference tissue (R1=K1/K1'). Therefore the map often has a similar appearance to a perfusion image. |
k2a |
k2a value which provides the best least squares fit. |
k2' |
k2 value of reference tissue. Note: a separate k2 is calculated for each pixel, although the reference tissue is always the same. The SRTM2 model supports the concept of a single physiological k2' as a constraint, resulting in smoother BPnd values. |
Notes:
1. The k2a parametric map should be checked in the initial setup of a processing protocol. The estimated k2a values should not be truncated by too narrow Range restrictions.
2. The calculation is slow relative to other reference models and might take several minutes to complete.
References
1.Lammertsma AA, Hume SP: Simplified reference tissue model for PET receptor studies. Neuroimage 1996, 4(3 Pt 1):153-158. DOI
2.Gunn RN, Lammertsma AA, Hume SP, Cunningham VJ: Parametric imaging of ligand-receptor binding in PET using a simplified reference region model. Neuroimage 1997, 6(4):279-287. DOI