PKIN always shows the model curve given the loaded input curve(s) and the configured regional kinetic model with the timing of the current study. The user may modify any of the defining parameters and observe the effect on the model curve, which represents the expected PET measurement. With the Create Synthetic KM Study facility well-defined and smooth TACs and blood curves can be generated which represent an ideal acquisition.
Synthetic Modeling Study Generation
1.In each region select a compartment model and define an appropriate set of parameter values.
2.For all blood components, configure a representative model function. This is most easily achieved by fitting one of the available smooth functions to actual data.
3.Select the entry Synthetic KM Study in the Kinetic menu. A dialog appears showing the blood models and the model curve of the current region.

4.Initially all curves have the original sampling times. To modify sampling, use the buttons Set Blood Sampling and Set Tac Sampling. For instance, very fine sampling allows to generate smooth curves for publication or simulation purposes.
5.When Save Synthetic Study is activated, all regional TACs are recalculated with the current sampling, the old measurements are replaced by the values of the model curve, the original blood values are replaced by the values calculated with the current blood models, and the data is saved in a file specified by the user. Then, the original data are shown again. As a convenience for adding the generated data set there is also the button Save & Append as new Study available.
6.Finally, to see and work with the synthetic study, load the created file. The synthetic model curves are now the measured TACs, and the resampled blood curves have the Lin. Interpolation function associated. So any underlying model of the blood curves (which have been used for synthetic model calculation) get lost. This may cause small deviations between the calculated model curve and the saved synthetic TAC, depending on the density of blood sampling.
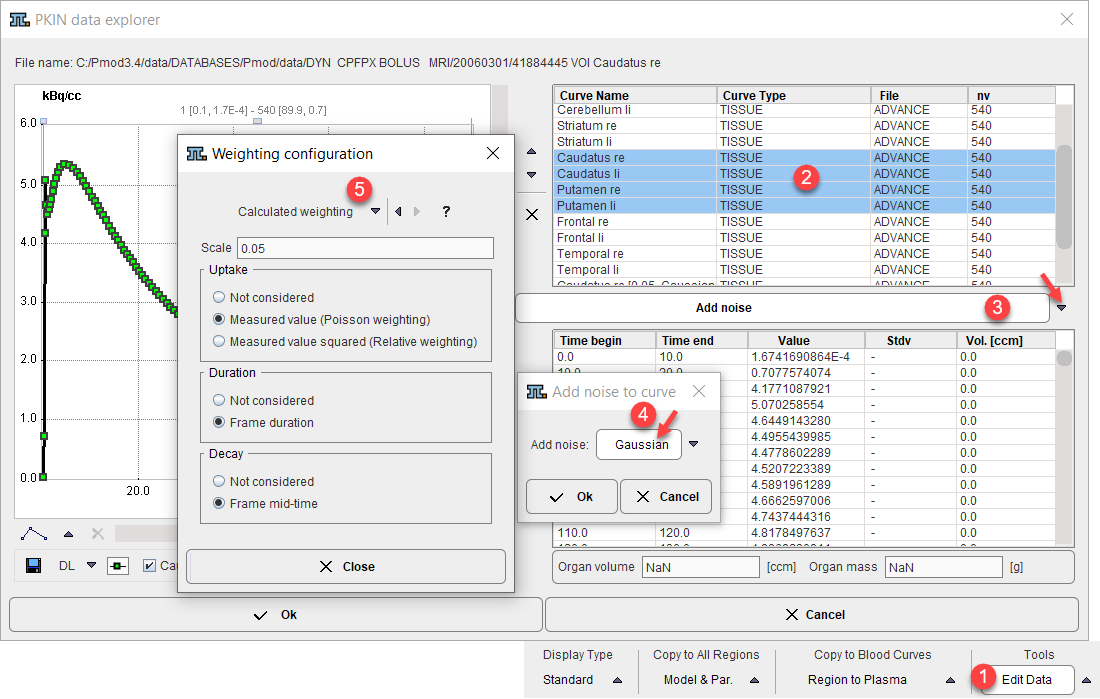
Note that after loading well-defined noise could be added to the synthetic curves using the Edit Data facility as illustrated below. Select the curves to be modified, activate the Add noise operation, configure the noise, and quit with Ok. The created curves are then appended to the existing regional data and can be saved.