Create Synthetic PXMOD Study is an extension of the Create Synthetic KM Study approach. The idea is that synthetic model curves can be generated for many different "tissues", ie. combinations of model parameters, at once. These curves are compiled into images, so that a synthetic study is generated which has a different combination of model parameters in each pixel.
For instance, TACs can be simulated by loading a .km file, selecting the 2-tissue compartment model and using the parameter ranges
Parameter |
From |
To |
K1 |
0.05 |
0.1 |
k2 |
0.05 |
0.25 |
k3 |
0.02 |
0.04 |
k4 |
fixed to 0.05 |
|
To enter these parameter ranges select Create Synthetic PMXOD Study from the File menu. The following dialog appears showing the parameters of the current model.

To define the synthetic study the following configurations must be set:
▪Which parameters are varied along the X, Y, and Z axis (Axis selection),
▪the value ranges of the varied parameters (Start from, Finish at),
▪the number of parameter increments to cover the ranges (X, Y, Z samples),
▪the acquisition times; initially the times of the loaded .km study are used, but they can be changed using the Set time points.
▪Add noise allows defining a noise generator for disturbing the ideal curves. In the example above, 10x10x10 curves with the same parameter combination would be created, so that the distribution of the estimated parameters could be analyzed to study their variance in the presence of noise.
Synthetic Data
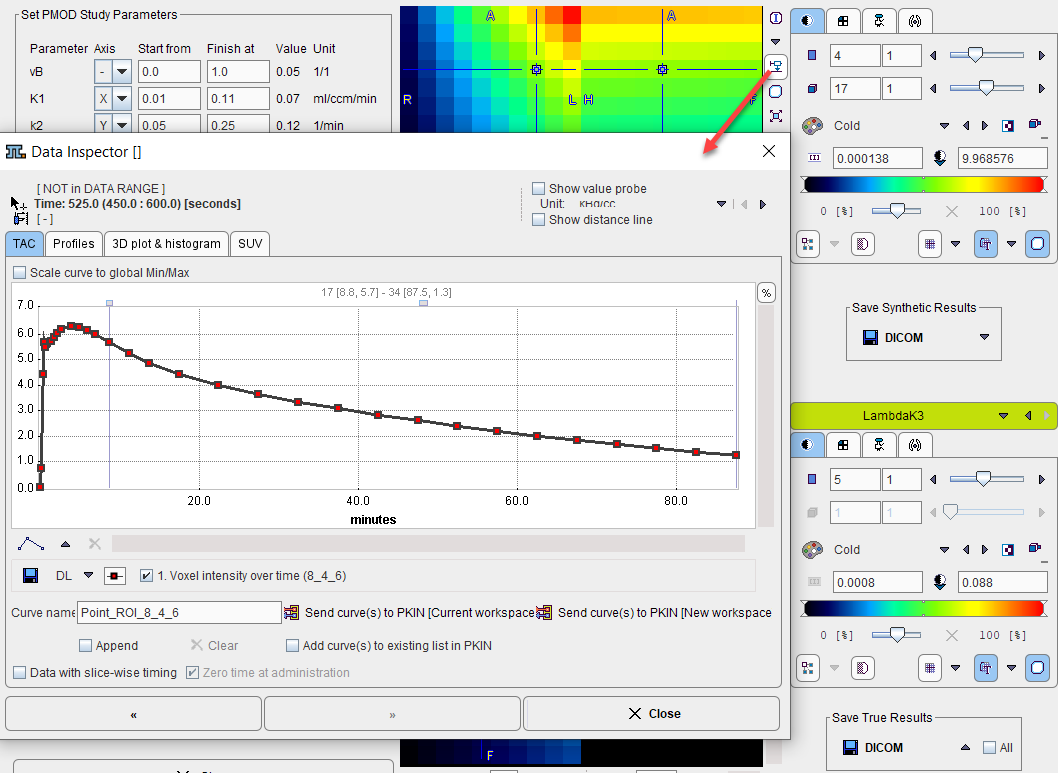
With Generate the model curves of all parameter combinations are generated and the data arranged as a 4-dimensional study. This synthetic study, which is suitable for pixel-wise modeling, is shown in the upper image display. In the example above the interpolation has been disabled to show the 10x10 layout of parameter combinations in plane. Note that the data inspector can be used for inspecting the curve in each pixel of the synthetic data set.
Use the Save Synthetic Results button to save the study in any supported output format.
Gold Standard
The lower image display contains images of the true parameter used in each pixel. These generation parameters can be saved using the Save True Results button. They can serve as the reference for the analysis of the outcome from a pixel-wise analysis of the synthetic study.