Model Configuration and Assumptions
Logan et al. [1] developed a reference tissue method for reversible receptor ligands which does not depend on a specific model structure of the reference tissue. Assuming the presence of reference region TAC CT'(t) with an average tissue-to-plasma clearance k2', the target tissue TAC CT(t) is transformed and plotted as a function of the transformed reference TAC, as illustrated below.
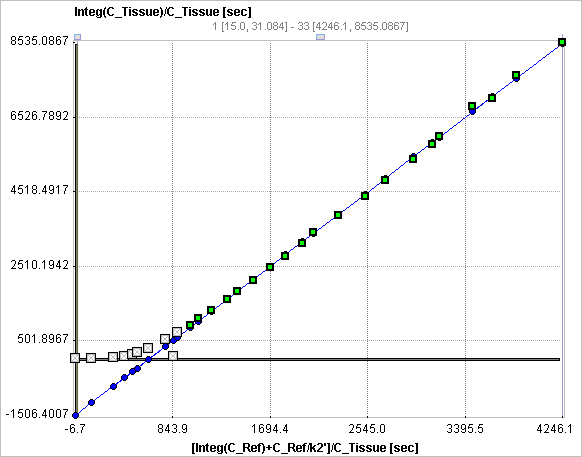
The operational equation resembles a linear equation with the distribution volume ratio (DVR = BPND+1) as the slope plus an error term which decreases over time. Therefore the late part starting from a time t* of the plotted samples can be fitted by a regression line and the slope used for calculating BPND. The time t* can be determined as the time after which no further significant increases in slope are observed.
Operational Model Curve
The graphical plot of the Logan Reference Tissue method is described by the following equation with the form resembling a linear equation.

k2' in the original publication was the population average k2 determined for the reference tissue using blood sampling, but using the subject's own k2' may be preferable.
Parameter Fitting
After switching to the Logan Reference model in PKIN a suitable reference region must be selected. k2' is an input parameter which must be manually entered, or estimated by using other models such as the MRTM or SRTM model. Logan Reference fits a linear regression to the tail of the plot starting at time t*. Note that t* is specified in regular acquisition time, which is translated into the "funny time" of the x-axis and shown as the Start parameter. The result parameter of interest is the BPnd which is calculated from the slope.
A reasonable value of t* can be estimated by the based on the error criterion Max Err. For instance, if Max Err. is set to 10% and the fit box of t* is checked, the model searches the earliest sample such that the deviation between the regression and all measurements is less than 10%. Samples earlier than the t* time are disregarded for regression and thus painted in gray. In order to apply the analysis to the same data segment in all regions, please switch off the fit box of t*, propagate the model with the Copy to all Regions button, and then activate Fit all regions.
Note: The k2' resulting from the SRTM or MRTM method might be a reasonable estimate for the average clearance rate k2'. Therefore, when switching in PKIN from the SRTM or MRTM model to Logan Reference model, k2' of those methods is automatically copied to k2', in case Model conversion in the Configuration panel is enabled. See above for recommendations how to estimate k2'.
Reference
1.Logan J, Fowler JS, Volkow ND, Wang GJ, Ding YS, Alexoff DL: Distribution volume ratios without blood sampling from graphical analysis of PET data. J Cereb Blood Flow Metab 1996, 16(5):834-840. DOI