Model Configuration and Assumptions
Starting from the operational equation of the blood-based Logan plot, Ichise et al. derived three multi-linear reference tissue model variants MRTM0, MRTM and MRTM2 [1,2]. They all assume an initial equilibration time t* from which on the derived multi-linear relation holds. However, if kinetics in the target tissue can be described by a 1-tissue compartment model (an assumption required for the SRTM), all data can be used for the fitting (t*=0). Otherwise an adequate t* value has to be determined.
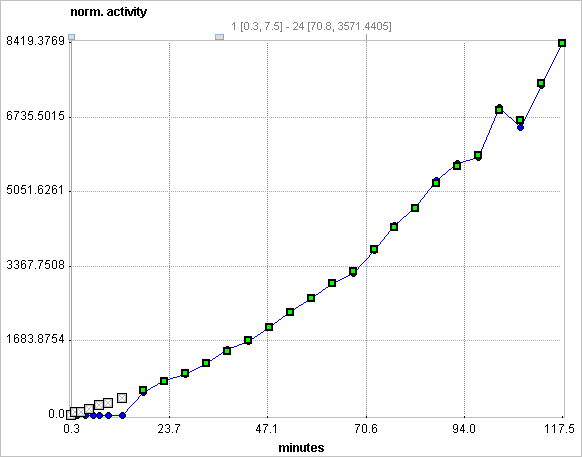
Assuming the presence of receptor-devoid reference region TAC CT'(t), the target tissue TAC CT(t) is transformed and plotted as a function of the transformed reference TAC, as illustrated below. For the calculation of BPND it is assumed that the non-displaceable distribution volumes in the tissue and reference regions are identical.
Operational Model Curve
The MRTM0 model curve is described by

where VT and VT' are the total distribution volumes of CT(t) and CT'(t), k'2 is the clearance rate constant from the reference region to plasma, and b is the intercept term, which becomes constant for T > t*. The multi-linear relationship above can be fitted using multi-linear regression, yielding three regression coefficients. From the first coefficient the binding potential can be calculated by

Parameter Fitting
After switching to the Ichise NonInvasive MRTM0 model a suitable reference region must be selected. It allows fitting a multi-linear regression to the operational equation within a range defined by the parameters t* and End Lin. The results are the three regression coefficients, and the derived binding potential BPnd.
A reasonable value of t* can be estimated by the based on the error criterion Max Err. For instance, if Max Err. is set to 10% and the fit box of t* is checked, the model searches the earliest sample such that the deviation between the regression and all measurements is less than 10%. Samples earlier than the t* time are disregarded for regression and thus painted in gray. In order to apply the analysis to the same data segment in all regions, please switch off the fit box of t*, propagate the model with the Copy to all Regions button, and then activate Fit all regions.
For receptor ligands with 1-tissue kinetics such as [11C]DASB the multi-linear equation is correct from t*=0, and b is equal to (-1/k2 ), where k2 is the clearance rate constant from the tissue to plasma. Furthermore, R1 = K1/K'1, the relative radioligand delivery, can be calculated from the ratio of the second and third regression coefficients.
References
1.MRTM0: Ichise M, Ballinger JR, Golan H, Vines D, Luong A, Tsai S, Kung HF: Noninvasive quantification of dopamine D2 receptors with iodine-123-IBF SPECT. J Nucl Med 1996, 37(3):513-520.
2.Comparison of the MRTM and SRTM models: Ichise M, Liow JS, Lu JQ, Takano A, Model K, Toyama H, Suhara T, Suzuki K, Innis RB, Carson RE: Linearized reference tissue parametric imaging methods: application to [11C]DASB positron emission tomography studies of the serotonin transporter in human brain. J Cereb Blood Flow Metab 2003, 23(9):1096-1112. DOI