Report (STRESS, REST separate)
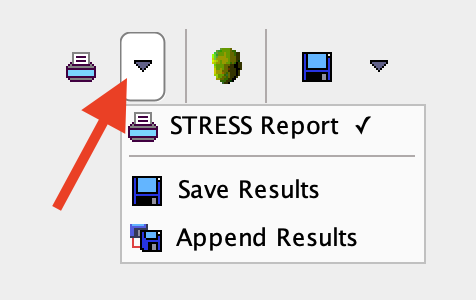
A report can be generated using the selection illustrated below.

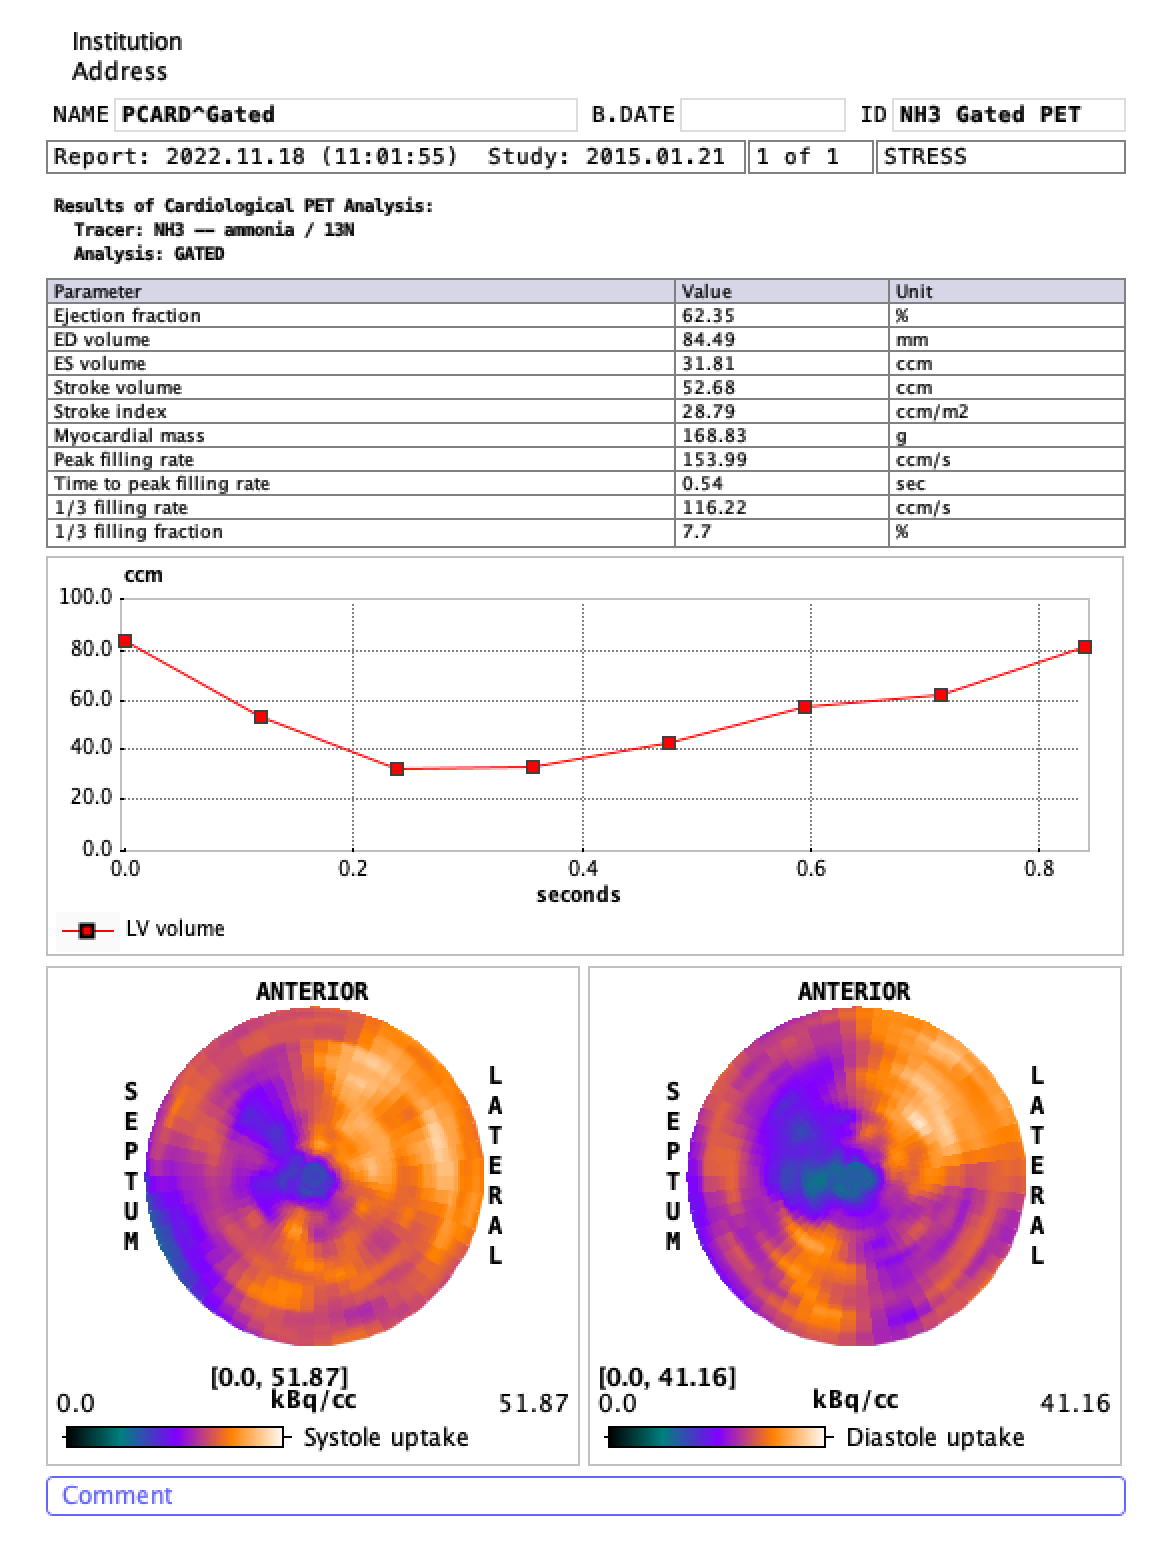
The layout is organized in three main sections: the upper section lists the functional parameters; the middle section shows the time-volume curve of the left ventricle; the bottom displays the Systole and Diastole uptake polar plots.

As usual, the report can be annotated, printed or captured in different formats and sizes. Note the buttons Print for printing the report, and Save as for saving the report in a graphic format (JPEG, TIFF) or in DICOM.
Save Numeric Results
The numeric results contained in the main report can be saved using the entry Save Results. This generates a simple ASCII text file which can be opened in many editors, such MS Excel, for further processing. Use the entry Append Results to append the results to an existing file.