Visualization of the Samples found by Polar Sampling (3D Option required)
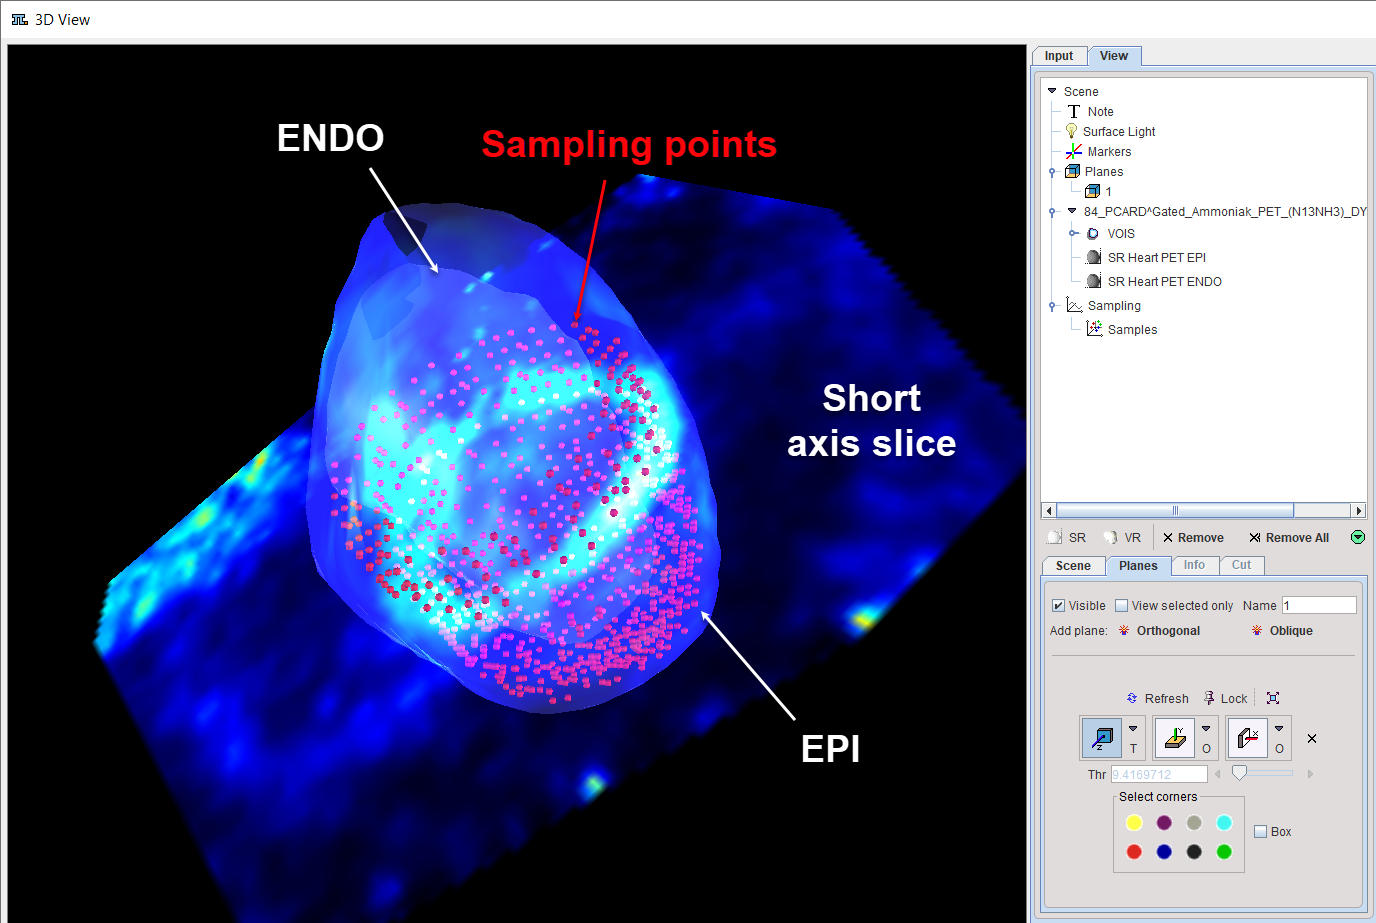
The pixels found during the sampling process can be visualized together with the short axis images using the ![]() button. The option View 3D rendering of Epi/Endo VOIs calls the 3D tool which renders the shape of the myocardium model together with the sampling points. The example below illustrates for gate number 8 the sampling points as red spheres, the myocardium ENDO and EPI models as a blended solid surfaces and a short axis slice of the anatomical images (myocardium) as a transparent contour.
button. The option View 3D rendering of Epi/Endo VOIs calls the 3D tool which renders the shape of the myocardium model together with the sampling points. The example below illustrates for gate number 8 the sampling points as red spheres, the myocardium ENDO and EPI models as a blended solid surfaces and a short axis slice of the anatomical images (myocardium) as a transparent contour.
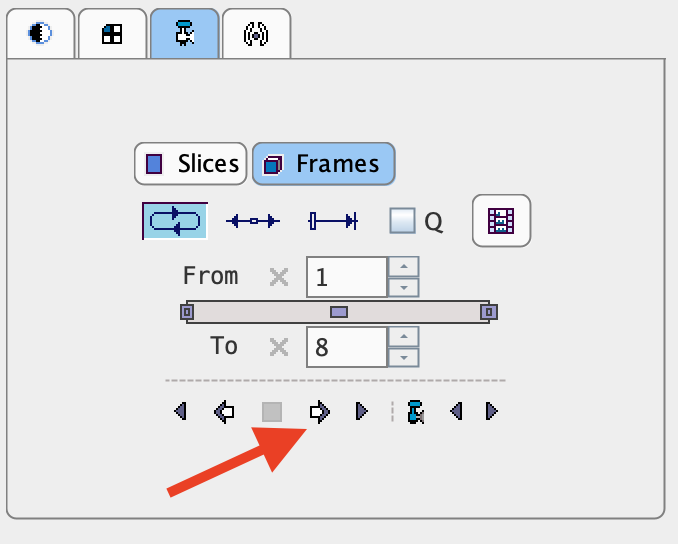
Inspect the sampling point in all gates configuring and running a movie on the Input pane: