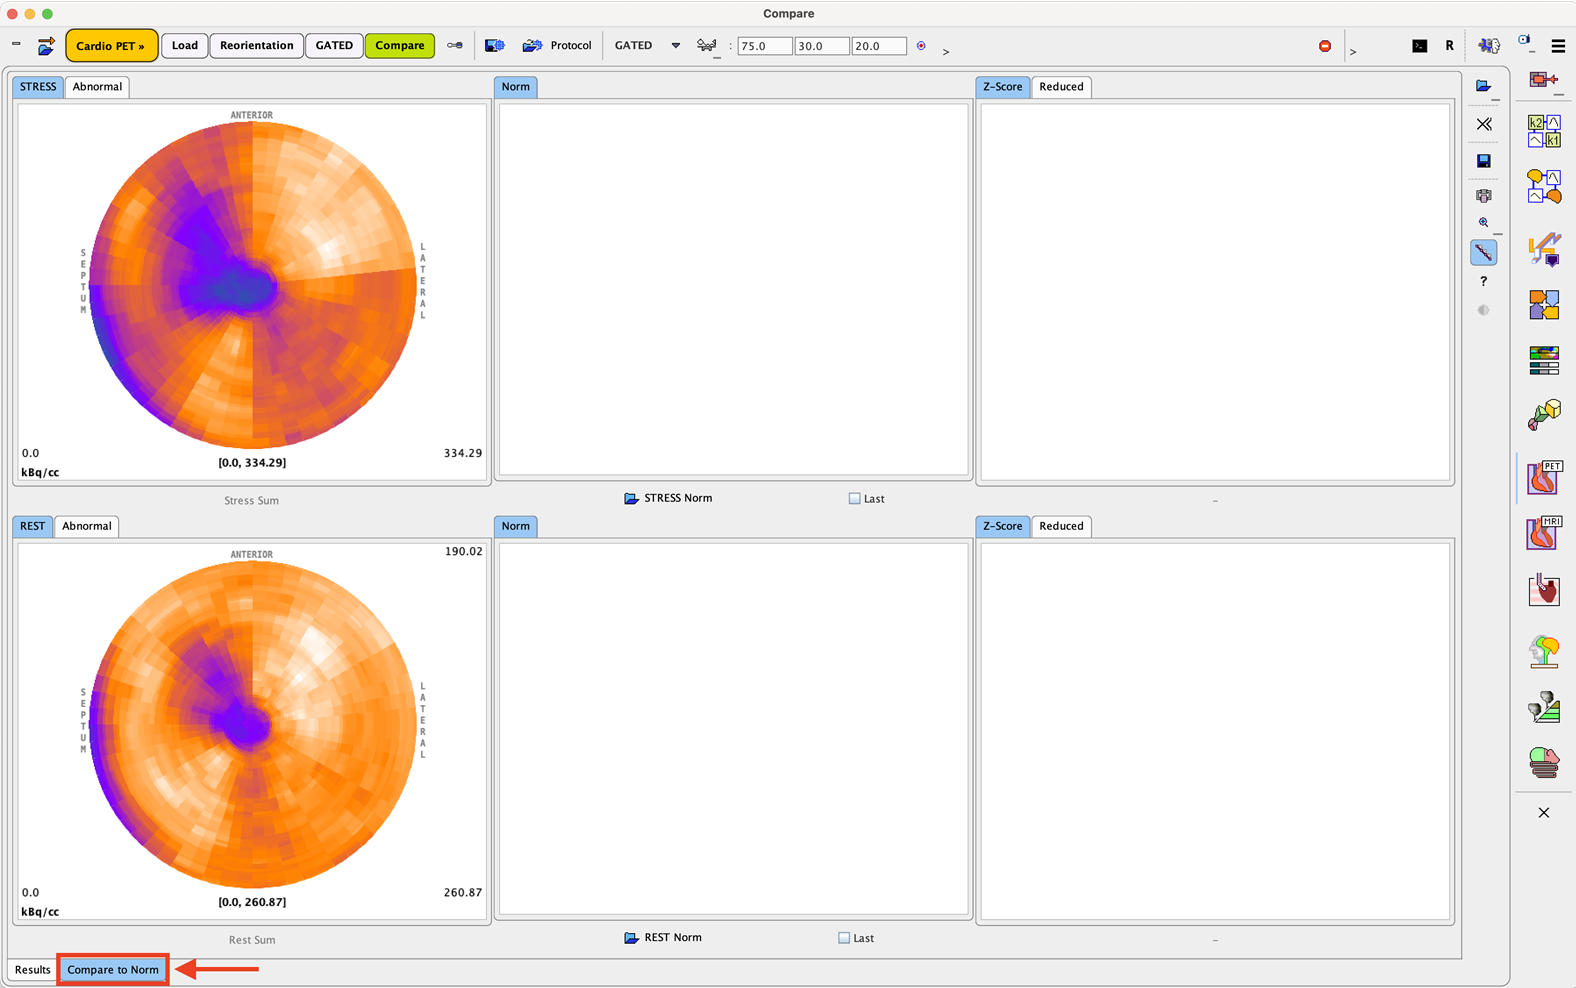
The example below shows how to compare the results of a GATED STRESS/REST processing with existing Cardiac Norm databases. For this purpose two normal Cardiac Norm were created: the normal STRESS SUM and the normal REST SUM. Simulated data were used for this purpose.
At the end of the gated data processing, on the Compare page, switch to the Compare to Norm tab as illustrated in the capture below. The page is organized into two rows: the upper row is dedicated for the STRESS SUM comparison analysis while the bottom one for the REST SUM.
Retrieve the STRESS and the REST norm using the STRESS Norm and REST Norm buttons respectively. The Cardiac Norm can be retrieved form the database or from the file system. The results of the comparison are returned as z-score polar plots and displayed on the Z-Score tab as illustrated below:
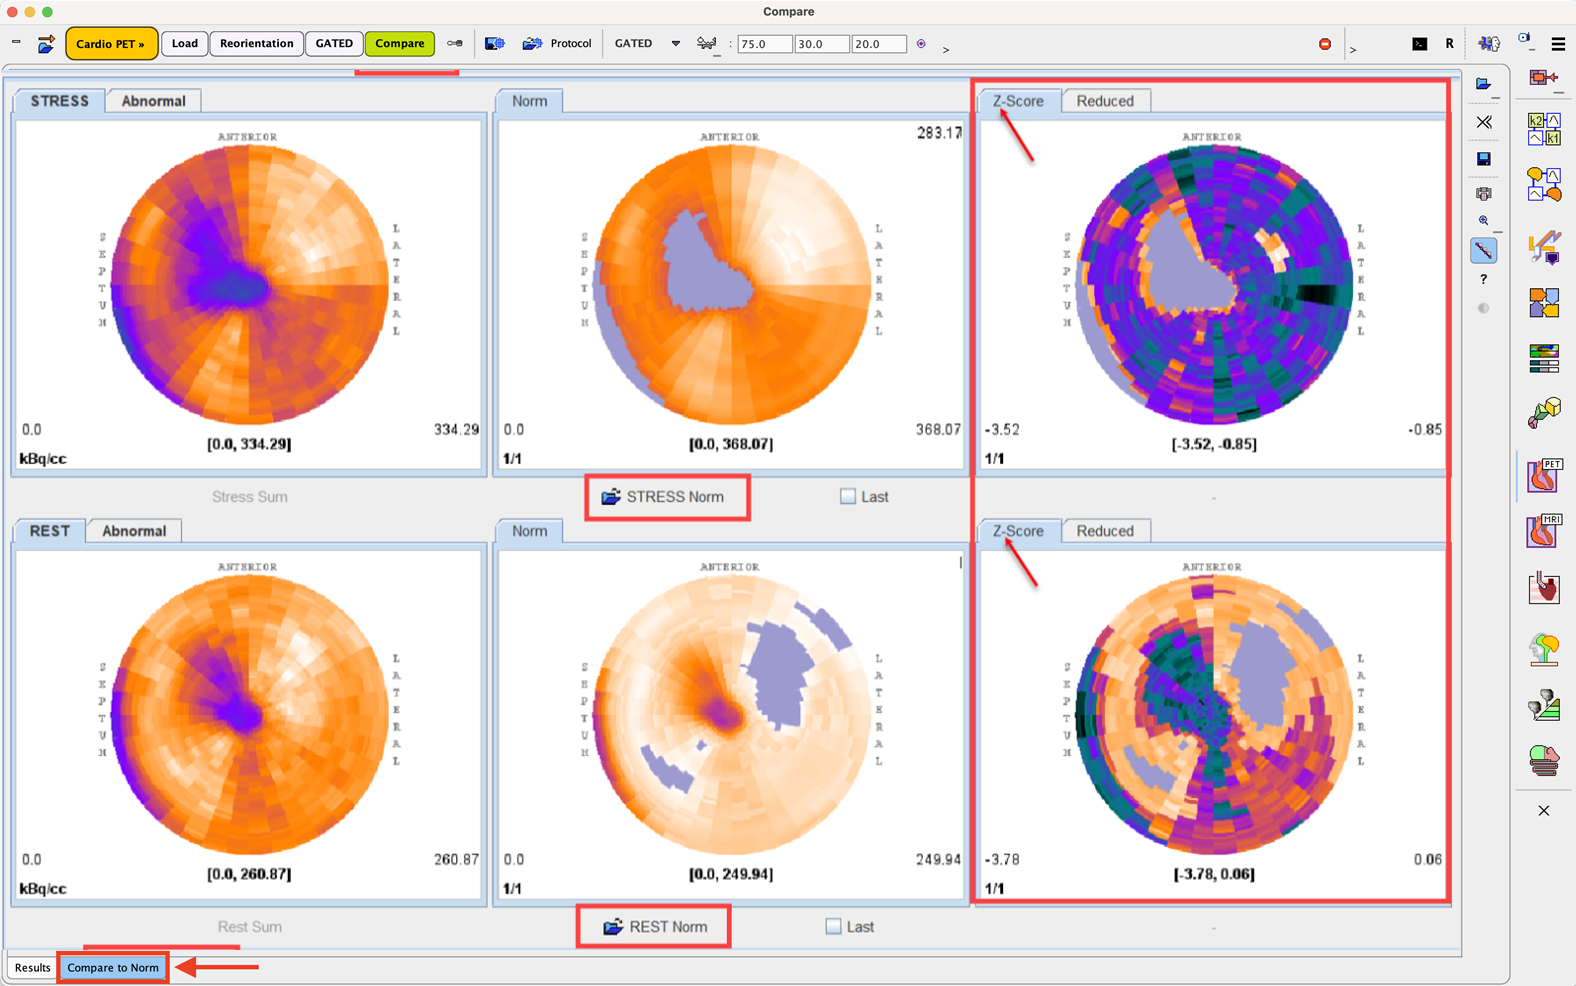
The Cardiac Norm calculation were done for both STRESS and REST norm enabling the In value range box: [250, 400] and [50, 250] respectively. The grayed out areas visible in the STRESS and REST norm polar plot indicate areas with values below the defined In value range box. No Z-Score will be available for these polar plot areas.
The Abnormal tabs display only the SUM polar plots values which are in the physiological range defined in the Norms. The STRESS and REST sum polar plot values which are not in the range of the corresponding Norm are considered abnormal. The abnormal values are replace by the average values and they appear as grayed zone in the abnormal SUM polar plots.
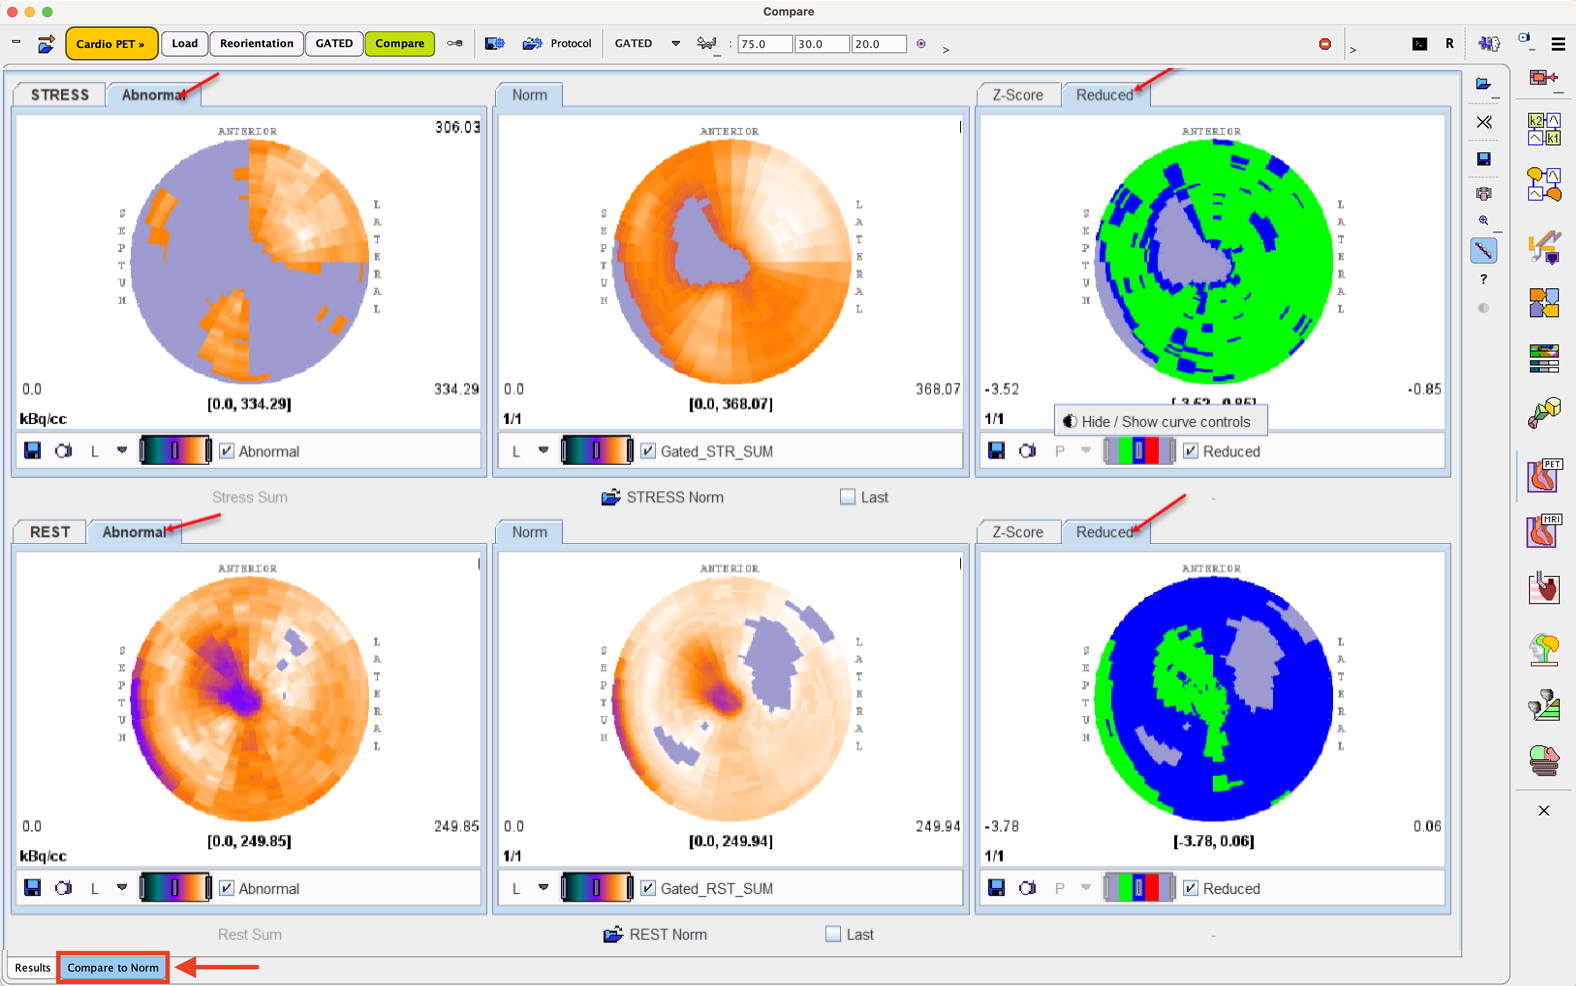
The Reduce tabs display the Z-Score values using a three color encoding based on three z-score intervals as follows:
•the green color for z-score values between [-4 and -2),
•the blue color for z-score values between [-2 and and +2) and
•the red color for z-score values between [+2 and +4].
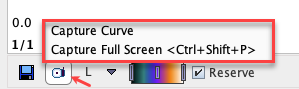
Using the right-click into the polar plot panels the controls are shown. The saving icon allows saving the polar plot information while the capture icon allows capturing the content of the selected panel (Capture Curve) or of the full screen (Capture Full Screen)
There are various options for the capture format as illustrated below:
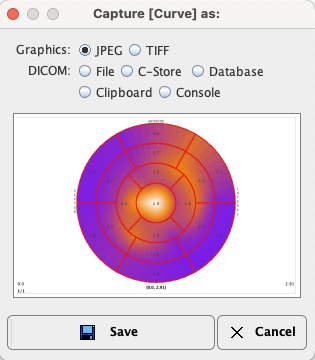
Using the DICOM File option the polar plots can be also saved as DICOM Secondary Capture objects.