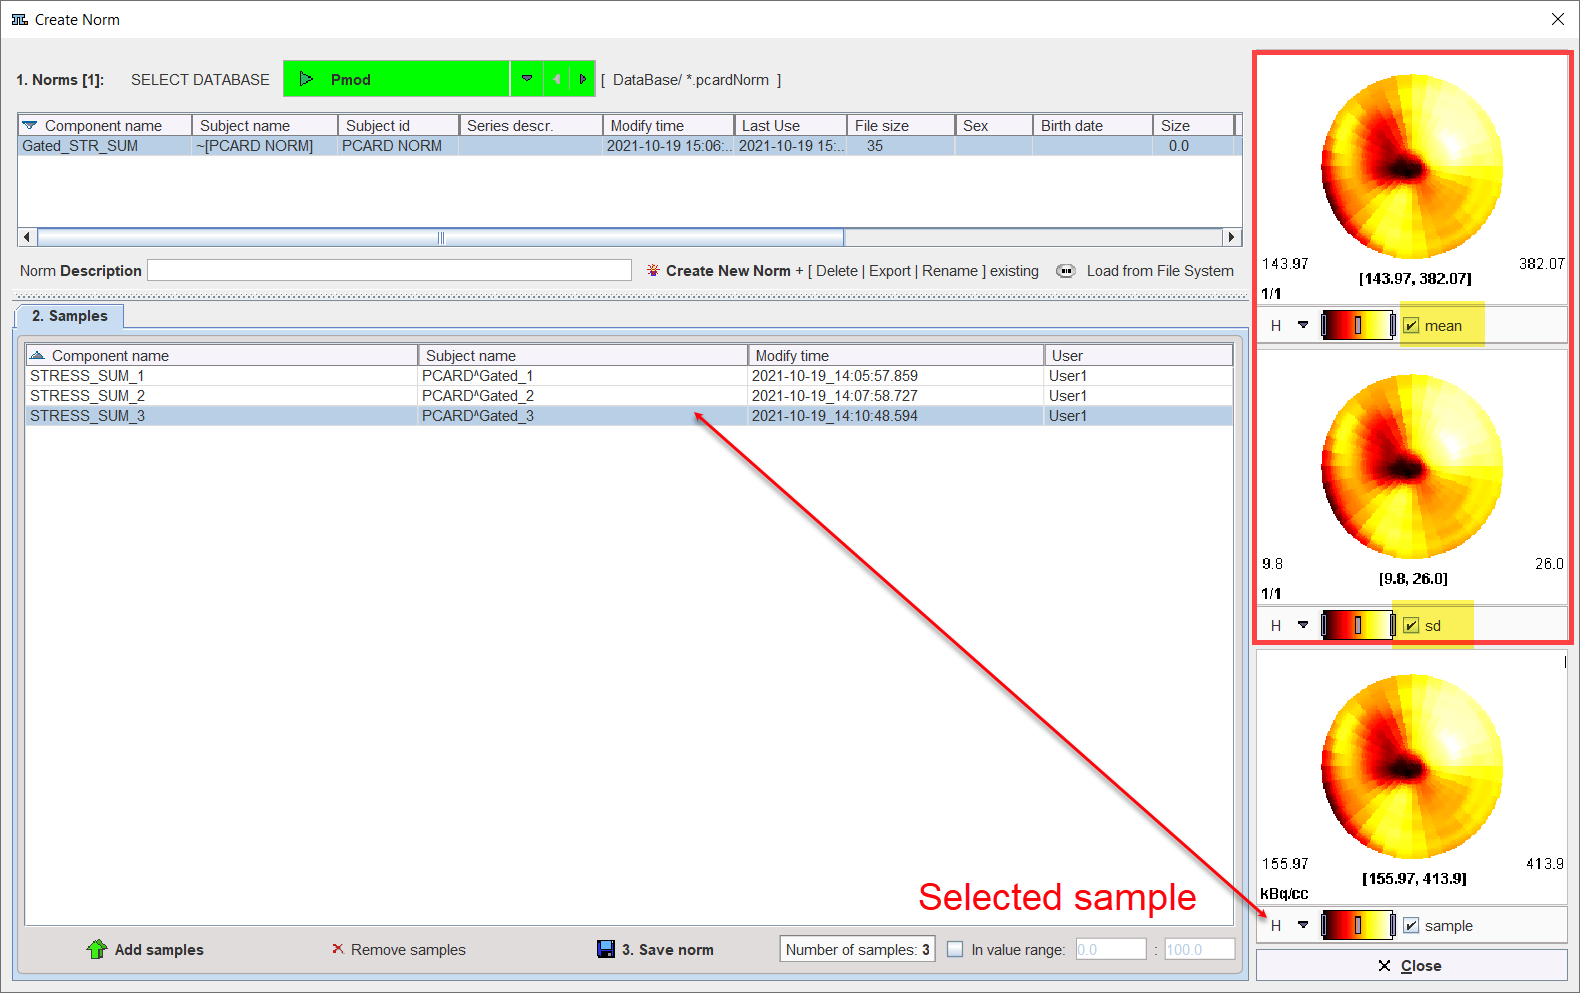
As soon as the polar plots Samples are available on the list the Cardiac Norm is calculated. The result of a norm calculation consist of the mean and the standard deviation (sd) polar plot. They are immediately displayed on the right side of the Create Norm dialog as illustrated in the capture below:
The last step after the Cardiac Norm has been calculated is saving with the Save norm button. Each time the Samples list is changed (e.g. new samples are added or some are removed) the Cardiac Norm must be saved again. The Number of samples indicates the number of entries in the Samples list.
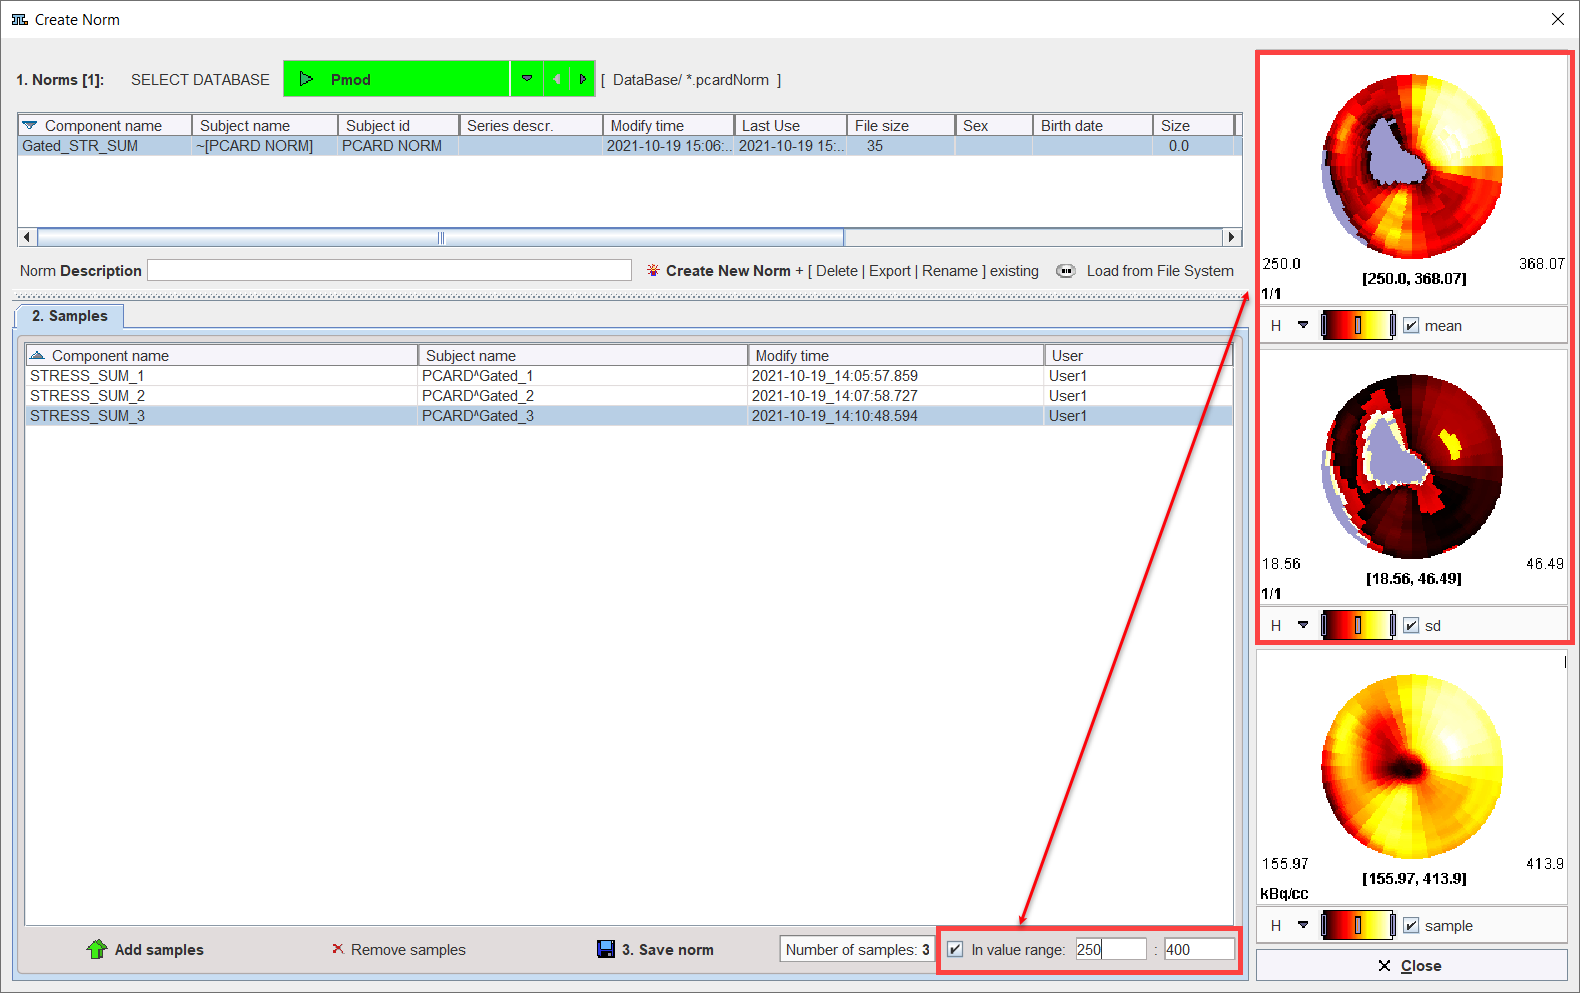
The In value range, when enabled, allows specifying the lower and upper value for the Norm calculation. In the example below the Norm calculation was restrained to values between 250 and 400. Please note that when restriction is applied the mean and sd polar plots range values changes as well.