Once the segmentation has been performed, the VOIs are ready to be applied to the dynamic CMR series.
The average MR signal in each segment is calculated. If the Linearity correction is enabled in the segmentation definition, the signal curves will be corrected so that the relation between the concentration of contrast agent and signal intensity becomes linear. If Linearity correction is not enabled, it is inherently assumed that due to the low concentration of the agent the relation is already linear.
Note: As of now the linearity-correction is not recommended because of lacking stability. As simplified alternative, baseline subtraction should be applied.
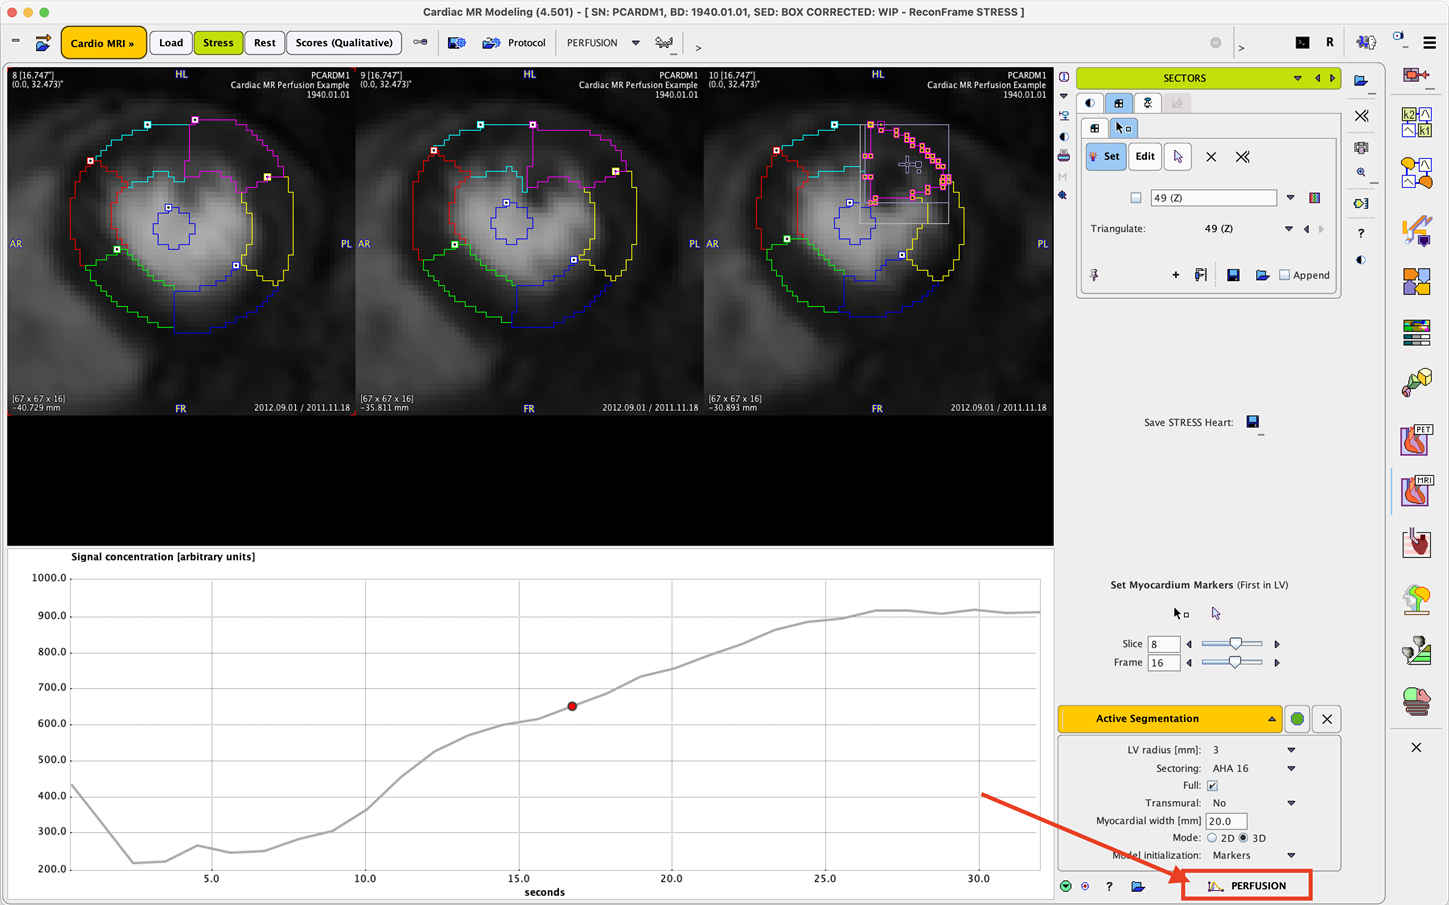
The process is started by activating the red TACs button in the lower right corner, and the resulting TACs will be shown on the next page MODELING.