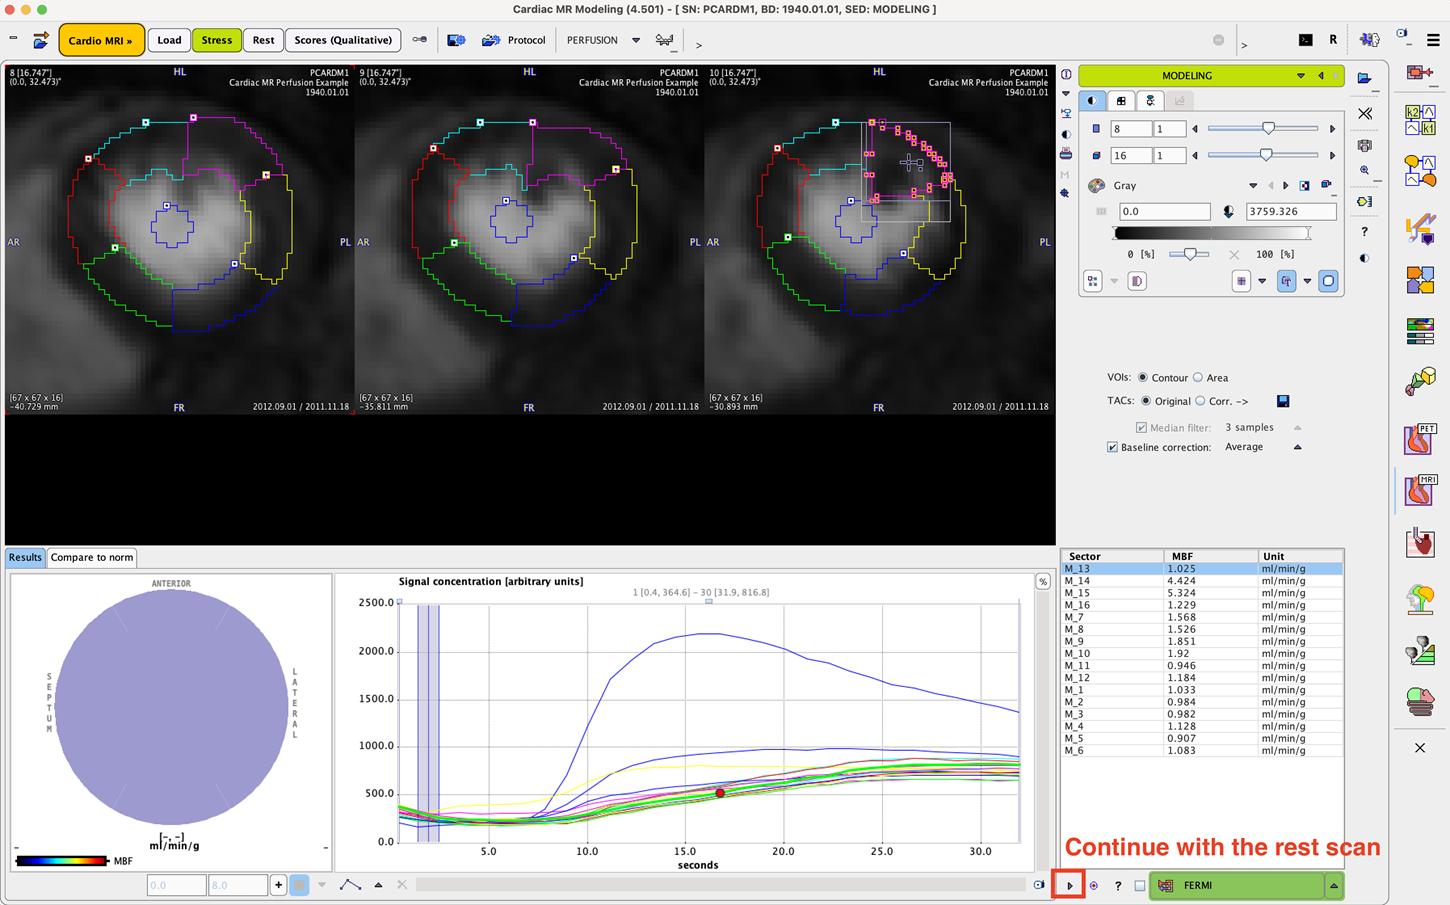
When the analysis of the stress scan has been completed, the results are listed in the table to the lower right, and visualized in a polar plot to the lower left (subject to segmentation method).

Please use the arrow button indicated above to proceed to the analysis of the rest scan, arriving at the INPUT page of Rest.

Please perform the same sequence of processing steps which were explained above for the stress scan:
▪data loading (with B1 inhomogeneity correction),
▪calculation of the contrast concentration curves, and
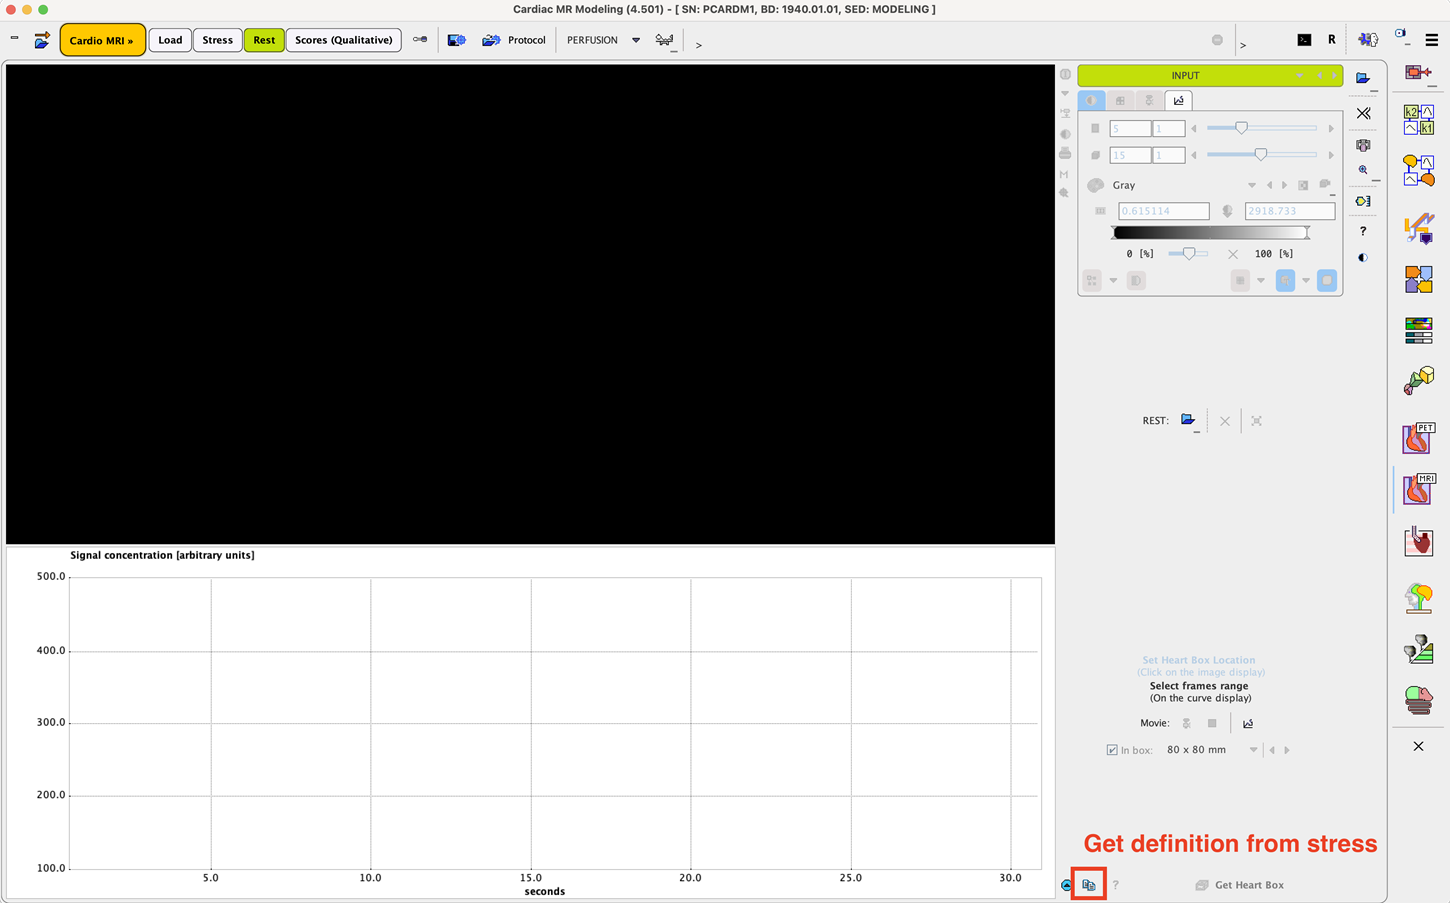
Note that on the pages in Rest there is a shortcut to conveniently copy the definitions from the corresponding page of Stress as indicated in the illustration above.