Results Inspection
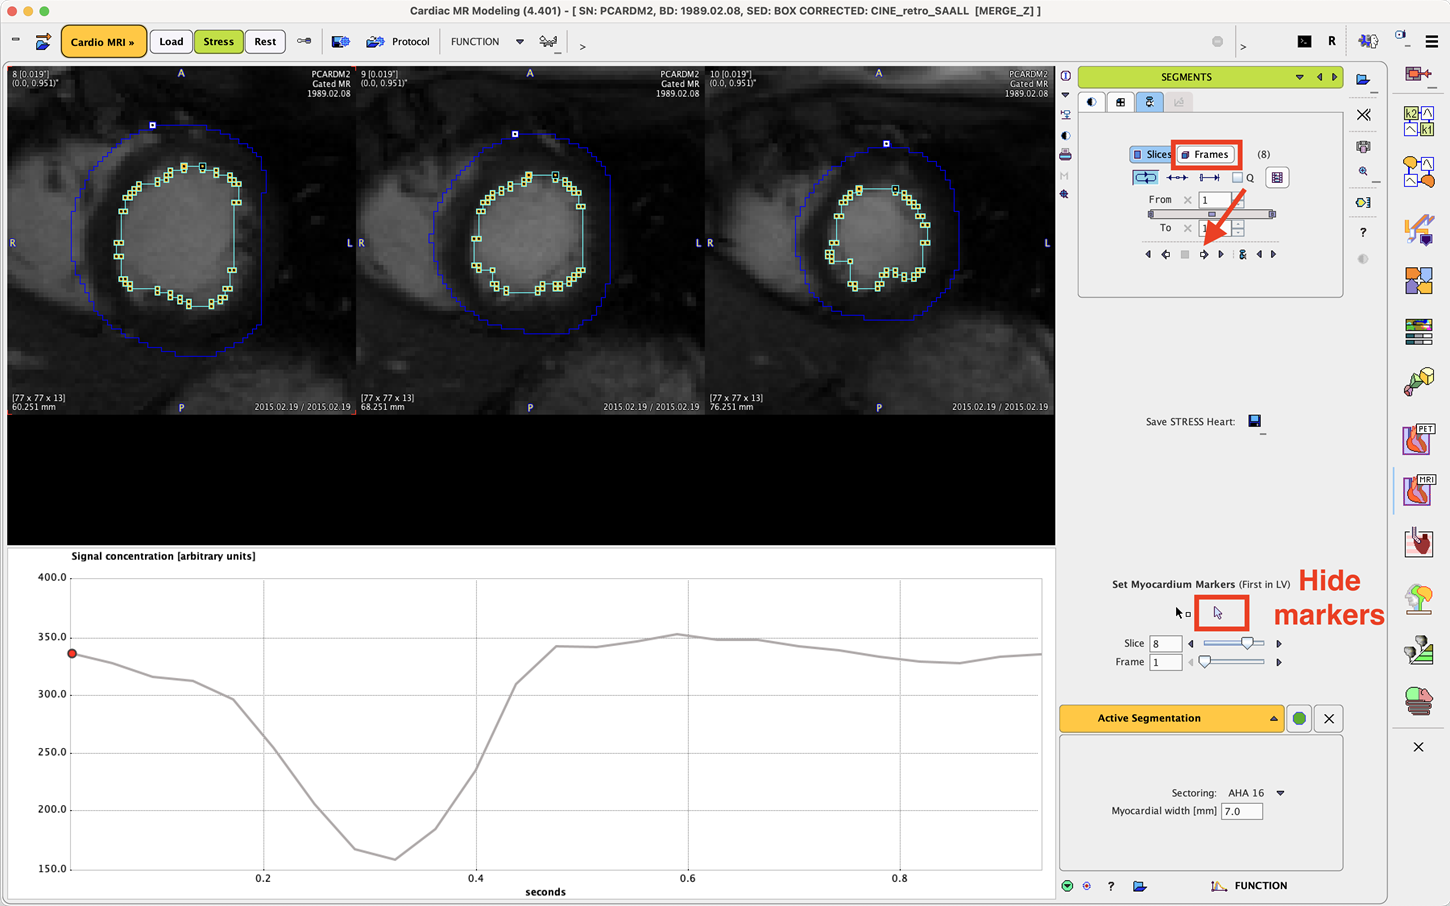
At the end of segmentation, the epi- and endocardial contours are shown on top of the image. For inspection of the results the Neutral mode should be active, so that the marker definitions are hidden.
Please browse the Slices and Frames to check the contours. It is also helpful to play a movie of the beating heart, to get an idea of the quality of the result. Note that the green edocardial contour will be used for estimating the ejection fraction and stroke volume and therefore needs to be reasonably accurate.
Contour Correction
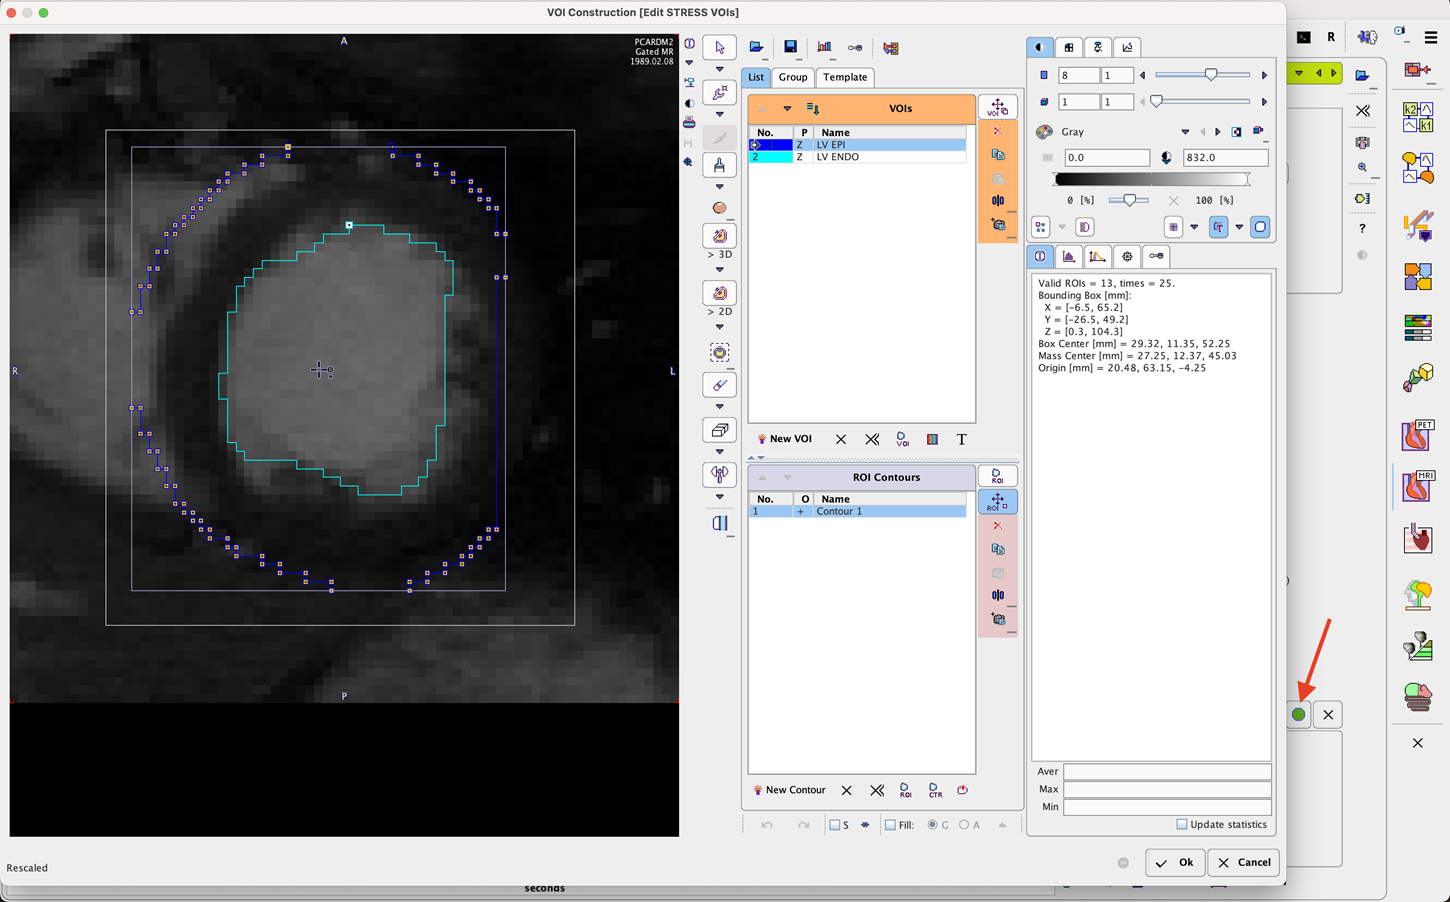
Minor contour adjustments can be done manually, whereas an alternate segmentation method should be tried in case of gross failure. The contours are opened for editing with the button indicated below. For editing a contour, please select it in the VOIs list and apply any of the standard VOI tools to apply changes as described in the PMOD Base Functionality Guide.
Close the dialog window with Ok to save the changes.
Analysis of Function
Activate the FUNCTION button in the lower right to perform the analysis of the ventricle during the heartbeat. The result is shown as illustrated below.
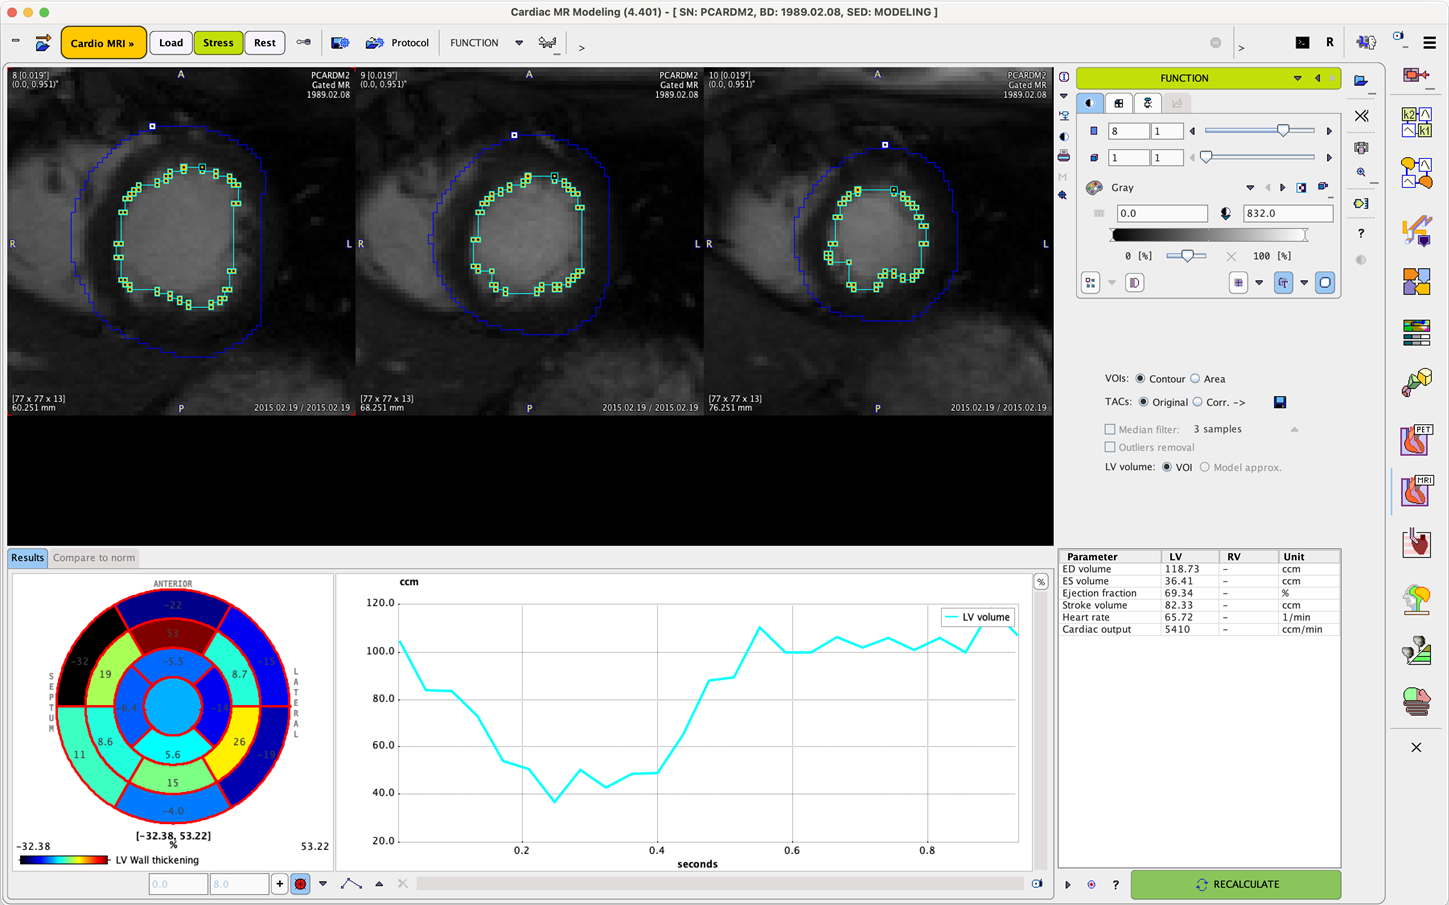
The table to the right lists the numeric results of the analysis of the LV volume curve which is plotted in the center:
Ejection fraction |
Fraction of outbound blood pumped from the heart with each heartbeat, calculated as (EDV-ESV)/EDV. |
ED volume |
Volume of the left ventricle at diastole. Determined as the biggest volume of the endocardial contour in the cardiac cycle. |
ES volume |
Volume of the left ventricle at the end of contraction. Determined as the smallest ventricle volume of the endocardial contour in the cardiac cycle. |
Stroke volume |
Blood volume pumped from the left ventricle of the heart per beat, calculated as EDV-ESV. |
Heart rate |
Heartbeats per minute. |
Cardiac output |
Blood volume pumped per minute (= Stroke volume * Heart rate) |
Caveat: The results need to be interpreted with caution if the LV is not fully covered by the slices in the data.
Wall Thickening
The polar plot to the left shows the average LV wall thickening in the myocardial sectors. Percent thickening is defined as wall thickness difference between end-systole and end-diastole, divided by end-diastolic thickness. Wall thickness is measured using rays from the LV center and it is defined as the distance between endo- and epicardium.
Right Ventricle (RV)
If the user creates a VOI enclosing the right ventricle and calls it "RV", the RV volume curve will also be analyzed and the results listed in the table.