Scatter plots are a convenient method for exploring tissue function, if matched image series are available. With the brain PET example illustrated below,
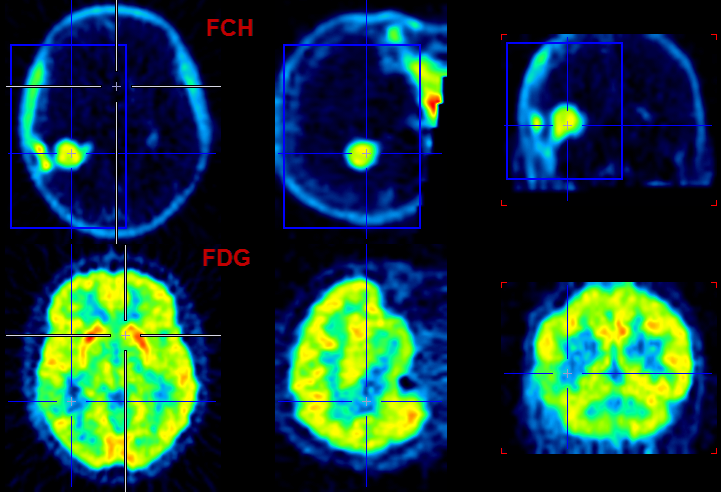
we get the following scatter plot of the pixel values in the blue VOI box.
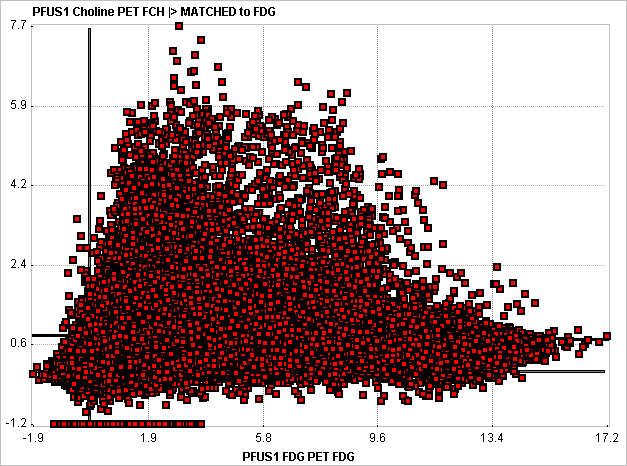
The FDG uptake of a pixel is plotted on the x-axis, and the corresponding PCH uptake on the y-axis. The Segmentation tool allows defining areas of interest in the scatter plot plane and mapping the enclosed pixels back to the image. The procedure converts the scatter plot to an image, in order to apply the standard PMOD VOI functionality for the area definition.
Segmentation Procedure
Please proceed as follows:
1.Load the two matched image series.
2.Define one or multiple VOIs on the first image series which enclose the tissue of interest, if needed the whole volume.
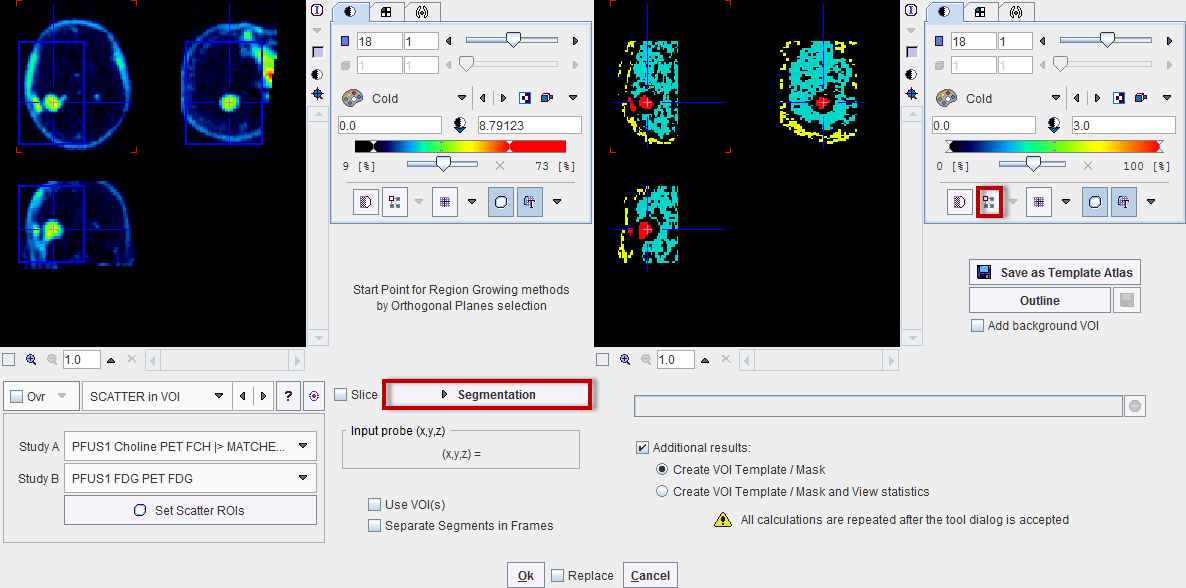
3.Select the Segmentation external tool, and chose the SCATTER in VOI method.
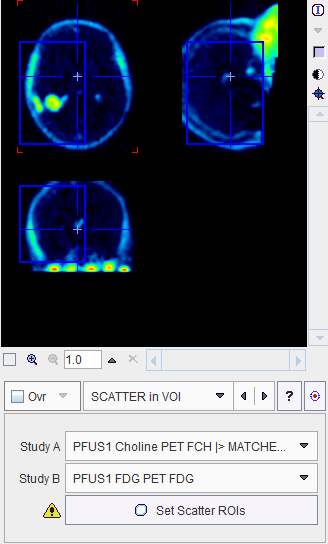
4.Using the list selection arrow, define the series with the defined VOI as Study A, and the other series as Study B.
5.Activate Set Scatter ROIs to create the 2D scatter plot.
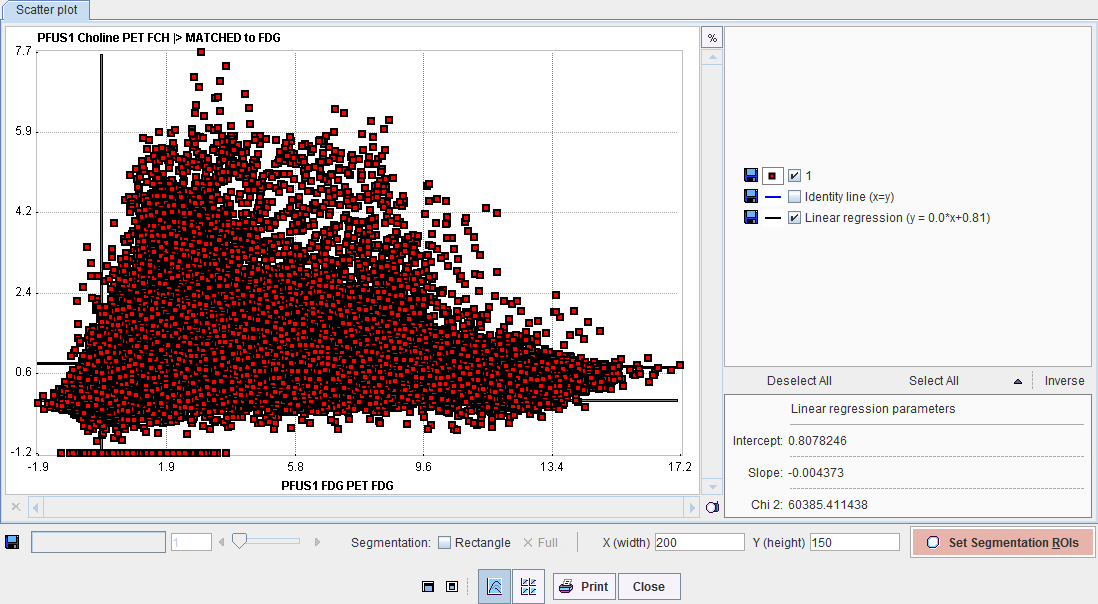
6.Convert the plot into an image by Set Segmentation ROIs. The X(width) and Y(height) define the number of image pixels in the two dimensions. The image value is given by the number of scatter points in the area of each image pixel.
7.A window appears showing the generated image together with the VOI definition interface. Adjust the color thresholds for localizing pixels with a specific uptake pattern and draw the ROIs.
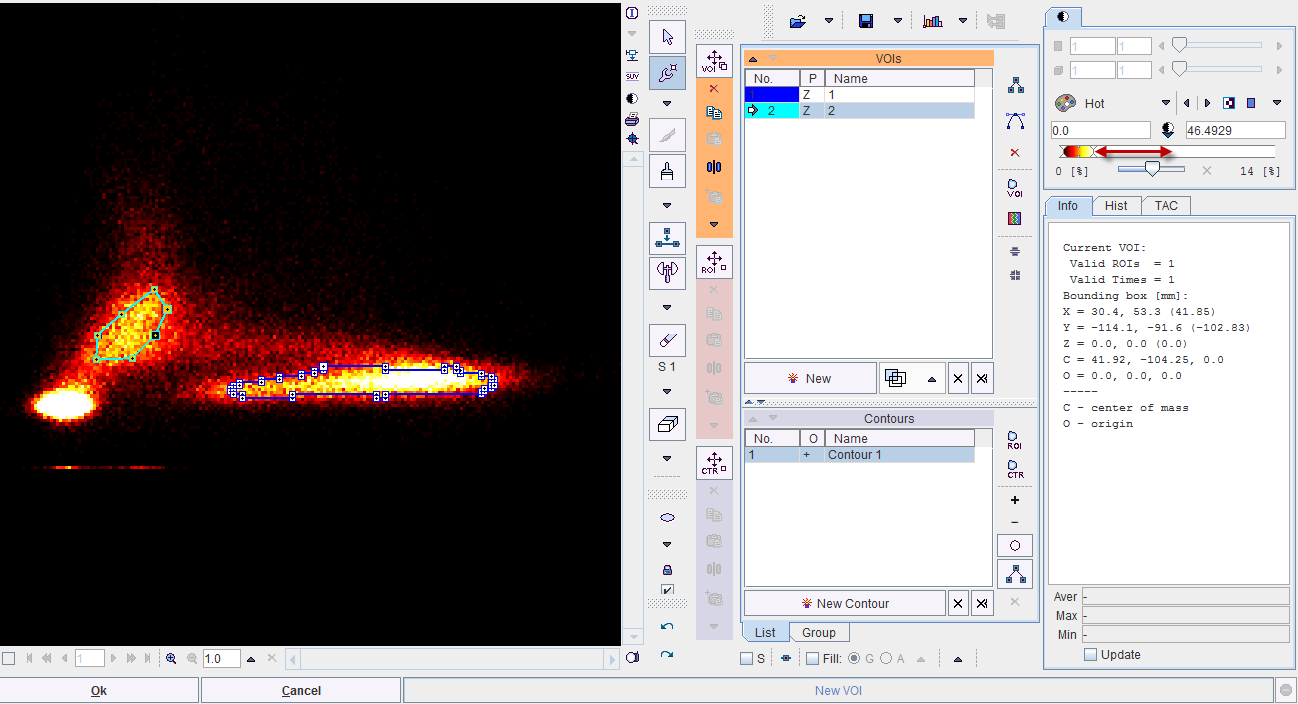
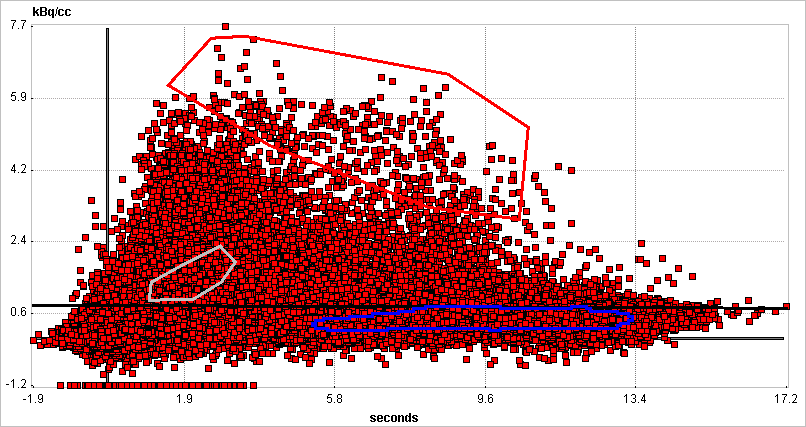
8.Closing of the VOI interface with OK returns to the scatter plot which now also displays the ROIs.
9.Complete the definition by the Close button to return to the Segmentation tool.
10.Now the scatter pixels can be mapped with the Segmentation button. The interpolation should be disabled to better see the generated segments. The result indicates that the tumor pixels were well characterized by the red ROI in the scatter plot.
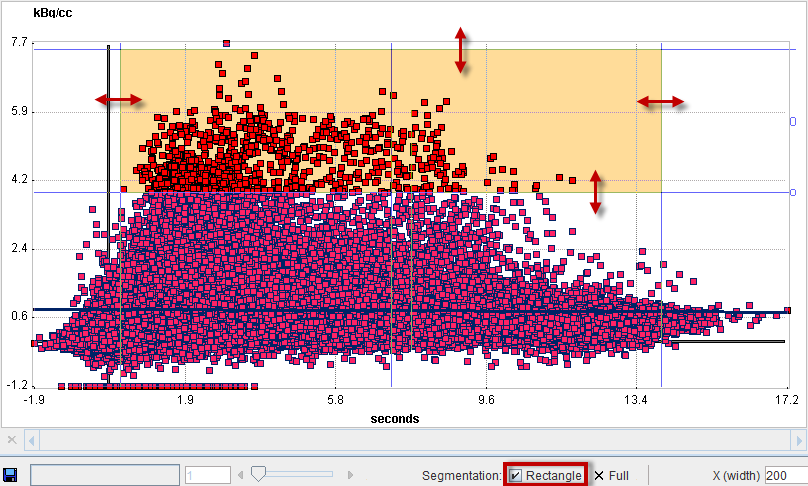
Rectangle ROI
A quick alternative to going through scatter plot rasterization and ROI outlining is to use a simple rectangular ROI. This functionality is enabled by the Rectangle box. A red-shaded area appears, which can be adjusted by dragging the edges. Segmentation will map the pixels in the defined rectangle.