PET imaging of the dopaminergic system results in images with high tracer uptake in the basal ganglia:
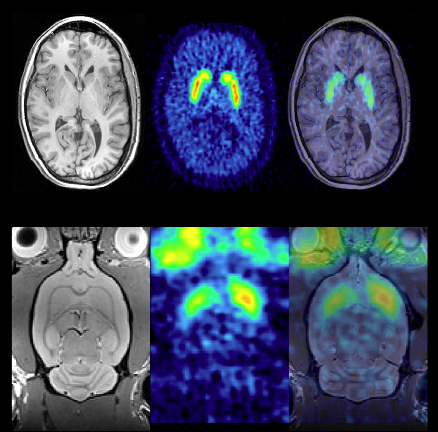
Fully quantitative analysis of PET with tracers for targets in the dopaminergic system typically uses time-activity curves from the striatum (in small animals; caudate and putamen in humans) and cerebellum (reference regions devoid of dopaminergic neurons/synapses). Dynamic PET studies typically cover a time range from 0-60 minutes after intravenous tracer injection.
In both small animals and humans, brain VOI atlases and tracer-specific templates such as those available in PMOD have long been used to achieve reproducible analysis and facilitate batch processing. The application of VOI atlases and templates used depend on the availability of anatomical imaging series to complement the PET data. In small animal dopaminergic PET studies it is common to have only the dynamic PET data. Matching to a PET template normally requires averaging in a time range that reveals specific binding and reduces image noise. Due to the limited tracer distribution researchers sometimes struggle to achieve a satisfactory result.
PMOD's Rodent Brain analysis tool (PNROD) provides a streamlined workflow for such analysis and with careful creation of a template image and selection of the averaging range works well for batch processing of rodent brain PET data. It was used to process 382 rat brain dynamic PET image series. The data comprised PET at a range of ages and with the tracers [11C]-raclopride, [11C]-methylphenidate and [11C]-DTBZ. A template image specific to this study data was created from a subset of the data using standard functionality in View and Fusion tools.
The traditional analysis workflow for this data is summarized below:
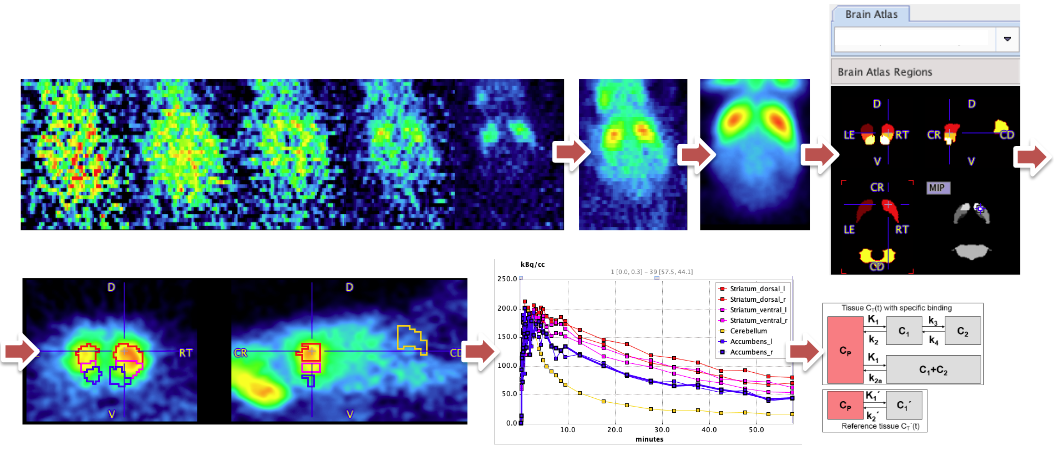
The dynamic PET data was averaged. This average was normalized to the template, allowing atlas VOIs for striatal regions and cerebellum to be created in the original PET image space. These VOIs were used to extract time-activity curves that were used for kinetic modeling. The Simplified Reference Tissue Model was used to calculate BPnd.
PMOD's AI framework (PAI) offers an alternative approach to segmentation of such data. 382 input samples represents a reasonable number for training of an ML model, and the VOIs generated by PNROD represent gold-standard method reference segments.
The Multichannel Segmentation architecture presented a potential advantage over the traditional workflow in that multiple averages can be provided as input. The average used for PNROD processing was selected to provide a specific-binding signal in the striatum but also some remaining blood pool signal to represent a more general brain outline. The cerebellum is not well defined in this average. Therefore an early average image created from the first 5 minutes after tracer injection and a late average of 30-60 minutes after tracer injection were generated using Pipeline Processing and organized in a Database:
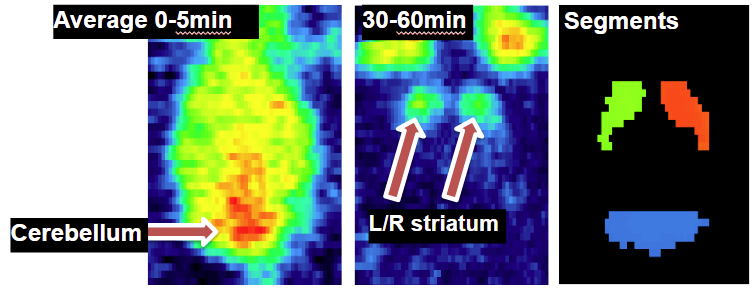
The VOI results from PNROD were converted into reference Segments using the Mask By VOI Number functionality available in the View tool and added to the Database.
The LATE and SEGMENT images were Associated with the EARLY image for each subject in the Database. The Project labels 1.Early and 2.Late were assigned to the EARLY and LATE images.
The Database was used to create a Learning Set for training with the Multichannel Segmentation architecture.