The Resting State (RS fMRI) model performs a seed-based analysis of resting-state fMRI data. The user has to specify a seed region, and the model calculates the Pearson correlation map of the seed region signal with the signals of all brain voxels, as well as a Fisher z-score map. If multiple seed regions are specified, the corresponding correlation maps and z-score maps are organized as successive frames in a dynamic result series.
Optionally, a file with potentially interacting regions can be specified. In this case, the mutual correlation of their regional signal average is calculated and a correlation matrix created which is visualized as an image.
Acquisition and Data Requirements
Image Data |
resting-state fMRI data |
It is recommended to define a mask and then proceed with the TACs button.
Seed VOI Definition
It is mandatory to define one or multiple seed VOIs on the VOIs (TACs) panel. This can be done by interactive outlining, or by loading previously defined VOIs with the button indicated below. If more than one VOI is defined as in the example, a static correlation map will be calculated for the active VOI in the list. However, an additional series is created which contains the correlation maps corresponding to the VOIs as frames in a dynamic series.
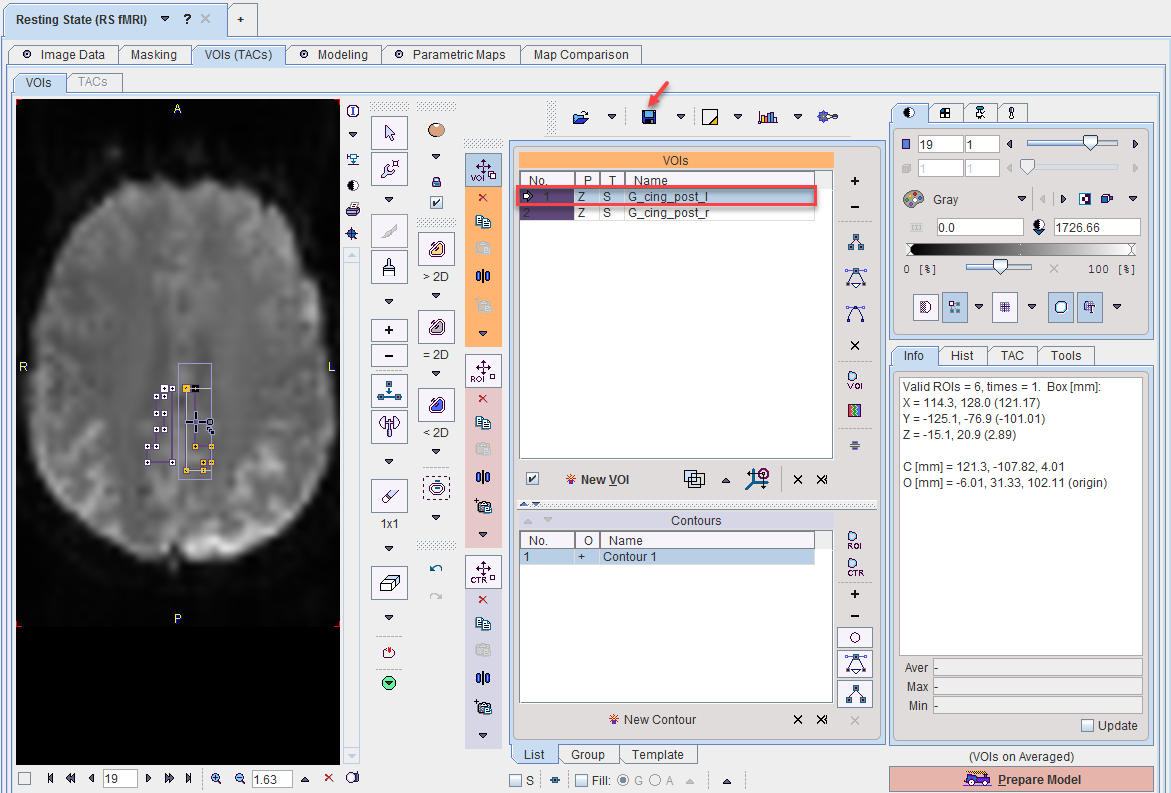
Note: the seed VOIs are not stored in the protocol.
Model Preprocessing
Preprocessing of the resting-state fMRI data is essential for meaningful results. When arriving at model preprocessing, please enable the optional corrections which are considered necessary.
The following options are supported and performed in the order specified. The result of all these preprocessing steps is the input for the correlation, and is provided as an additional result series.
Despike |
Removal of noise artefacts based on the median absolute deviation (MAD) using 9 samples in the time domain. |
Slice timing |
Resampling the data in time domain in order to obtain volume data with uniform timing. |
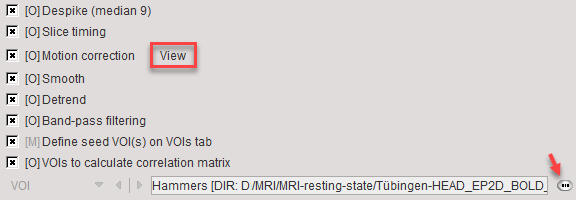
Motion correction |
Rigid matching relative to first frame. |
Smooth |
Spatial 9mm Gaussian filter. |
Detrend |
Linear trend removal based on linear regression. |
Bandpass filtering |
FFT based filter with range 0.01-0.08 Hz. |
Define seed VOI(s) on VOIs tab |
This entry is for information only, indicating that seed VOIs have to be defined or loaded on the VOIs (TACs) panel. |
VOIs to calculate correlation matrix |
File containing VOI definitions. The mutual correlation matrix between all average VOI signals is calculated and presented as an image. |
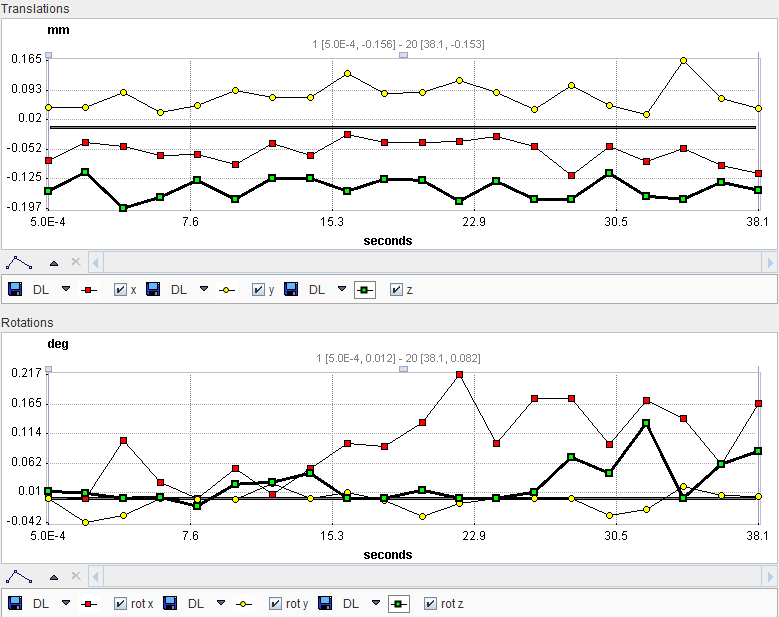
After motion correction has been performed, the resulting translation and rotation parameters for the successive frames of the series can be shown in a dialog window using the View button.
Model Configuration
The following two parameters can be selected.
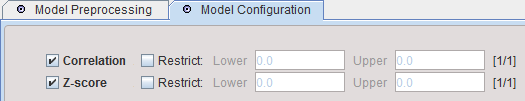
Correlation |
Pearson correlation. |
Z-score |
Fisher z-score. |
However, pixelwise calculation creates additional results which can be found in the list of parametric maps.
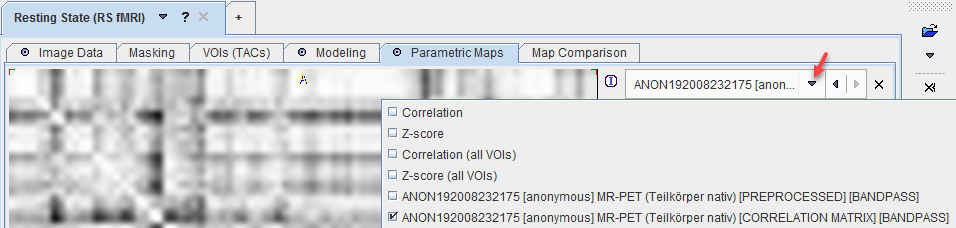
Correlation (all VOIs) |
Dynamic files with the correlation maps for the seed VOIs in ascending order. |
Z-score (all VOIs) |
Dynamic files with the z-score maps for the seed VOIs in ascending order. |
[PREPROCESSED] |
Dynamic series representing the data after all corrections. Is the input for the correlation calculations. |
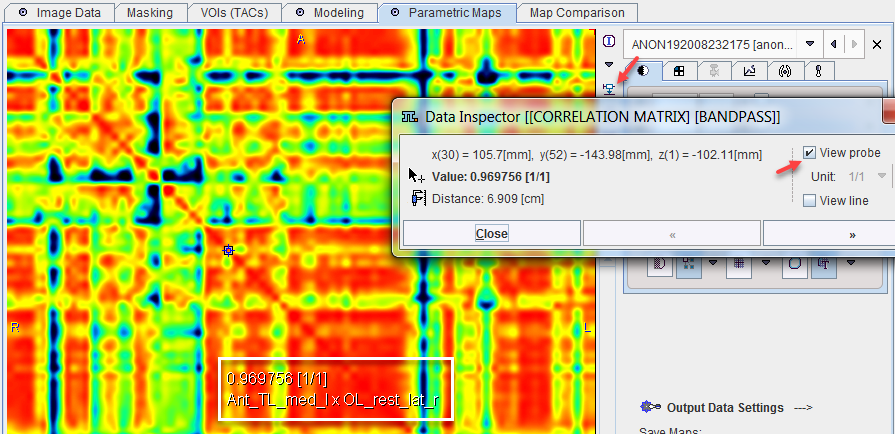
[CORRELATION MATRIX] |
Matrix of signal cross-correlation between all VOIs to calculate correlation matrix. |
The names of the correlated regions at a matrix location can be displayed using the inspector probe. When the correlation matrix is saved, the region names are stored in private DICOM elements. This information can be visualized in PMOD by opening the data inspector as illustrated below and activating View probe. When the cursor is then moved about the [CORRELATION MATRIX] image, the correlation value as well as the two VOI names are shown in the overlay.