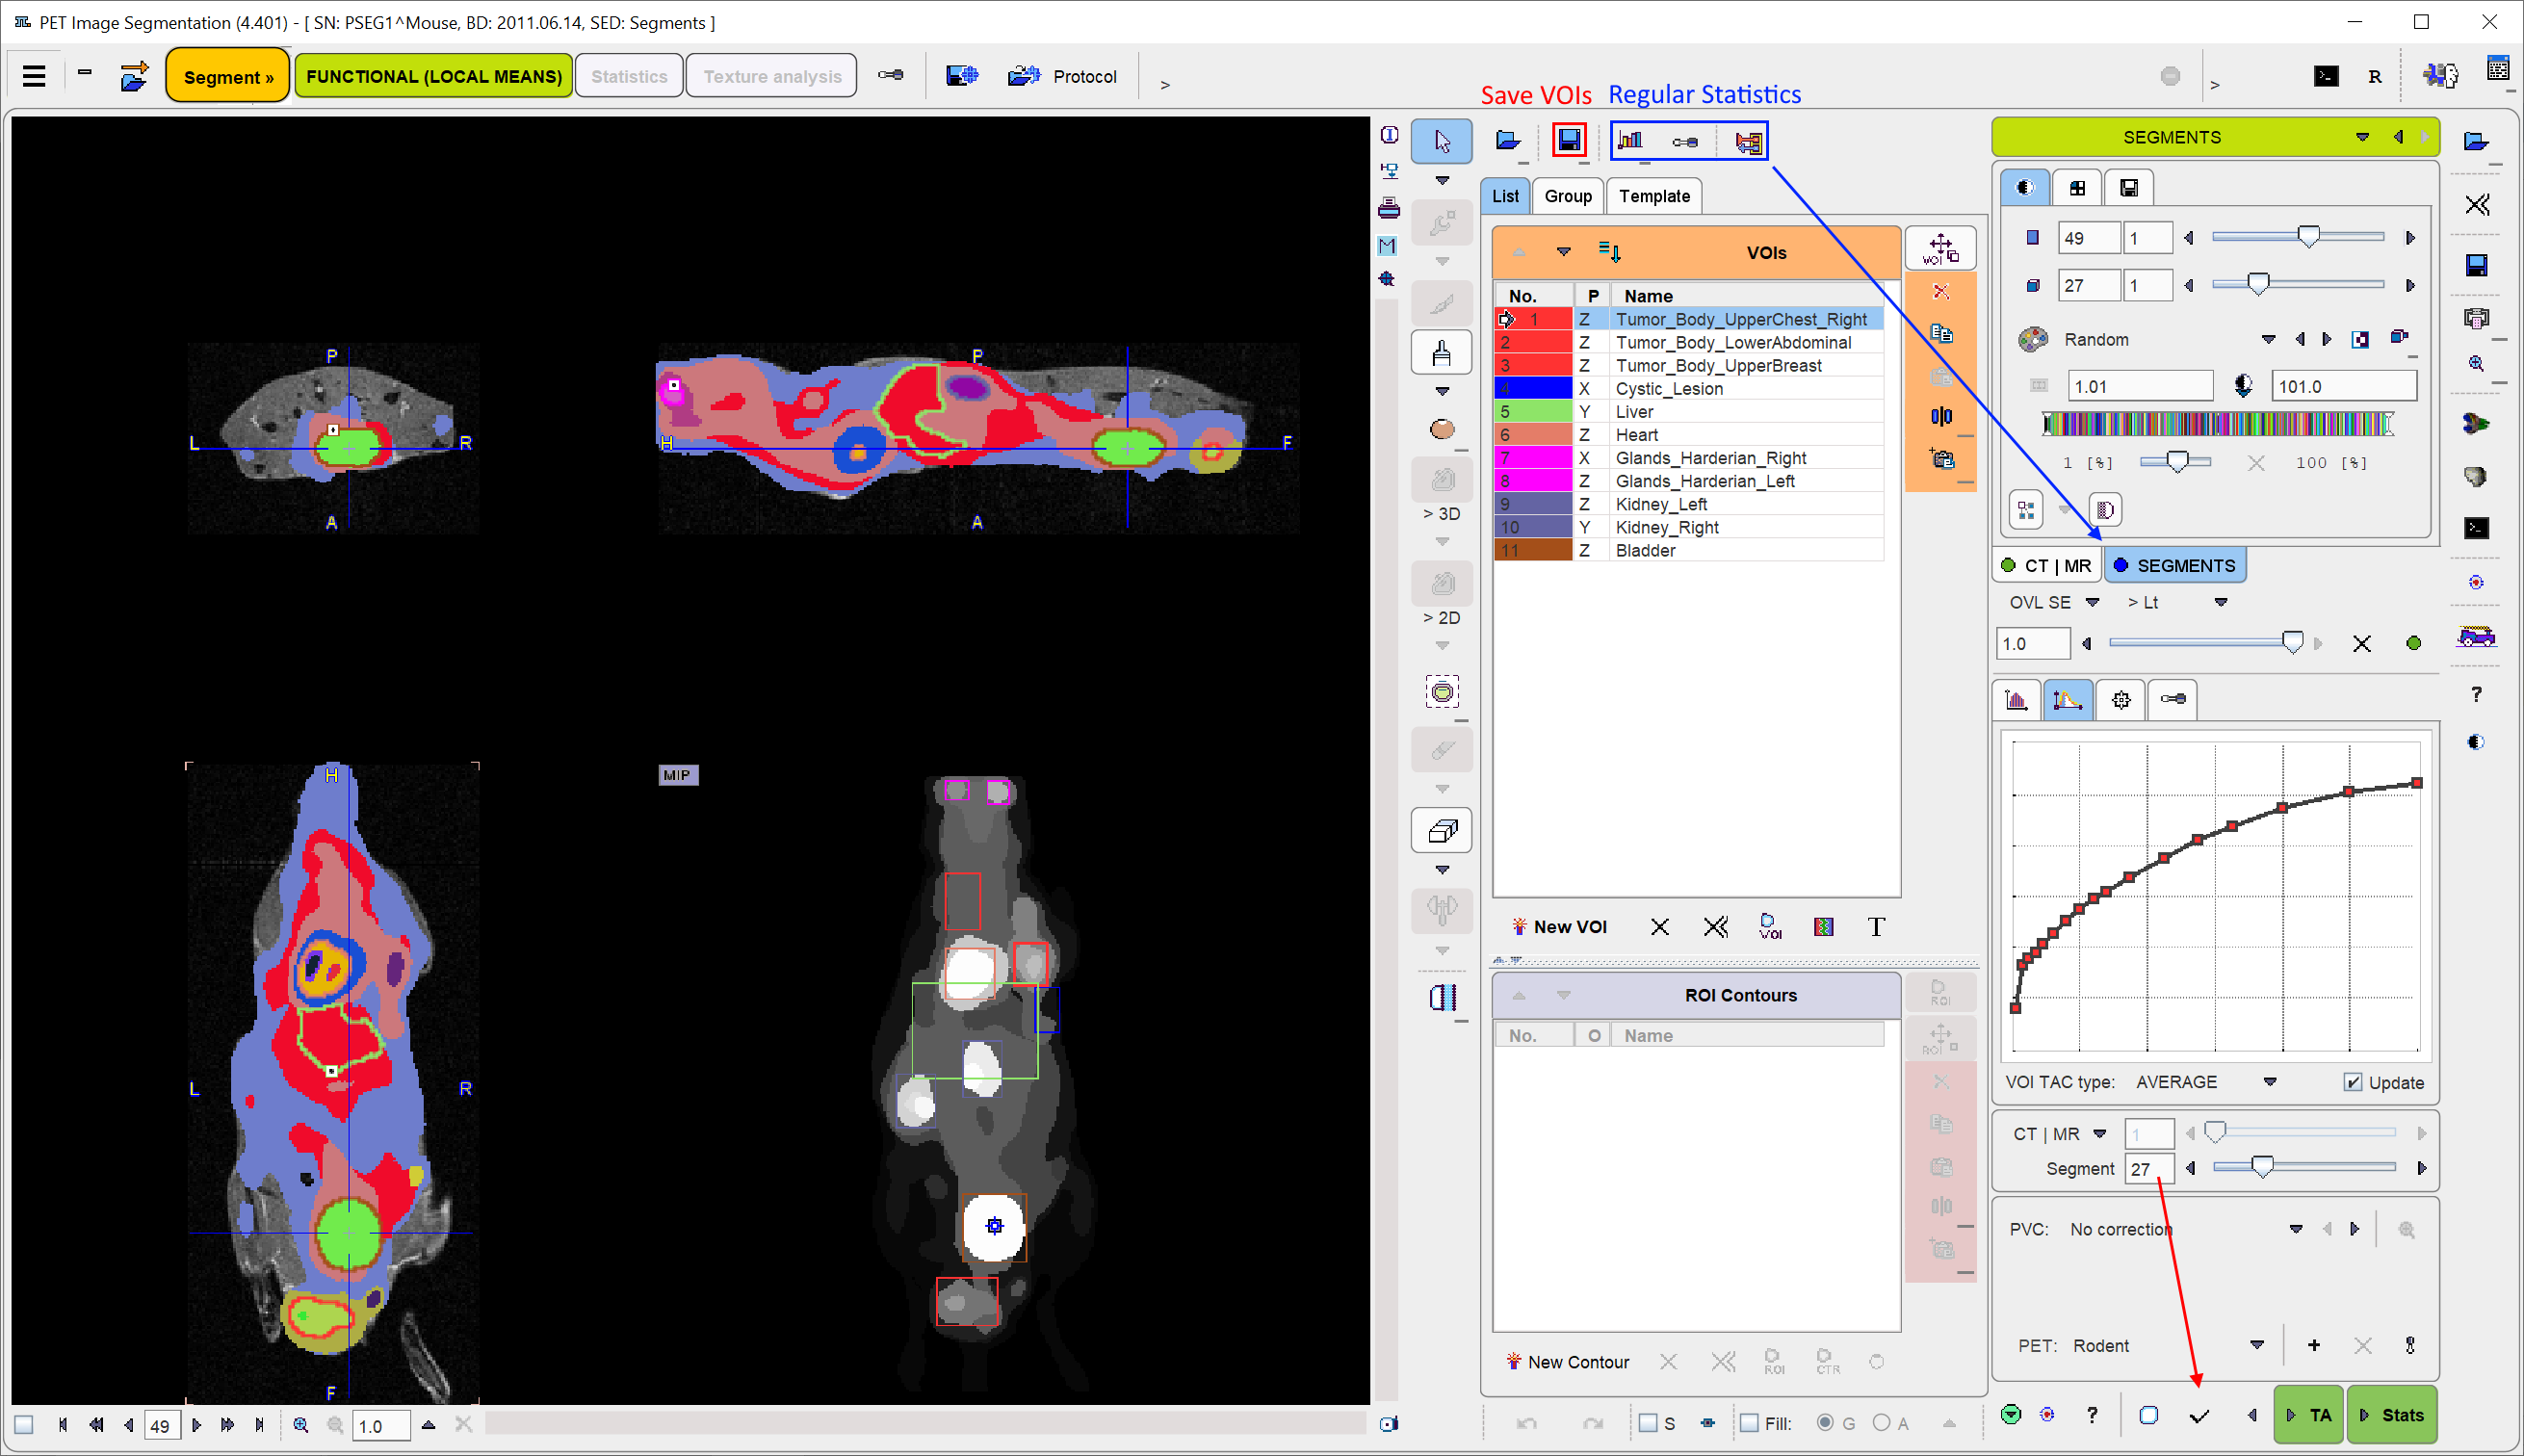
At the end of segment assignment and VOI editing the VOIs list contains all defined structures of interest. It is recommended saving them separately using the Save VOIs button illustrated below.
There are different variants for calculating statistics.
1.The regular statistics buttons above the VOIs list will operate on the selected image. In the example above, statistics would be calculated from the SEGMENTS image and be useless. However, the user might select the first image tab and the averaged PET as the reference image. In this case, statistics will result in the average PET uptake.
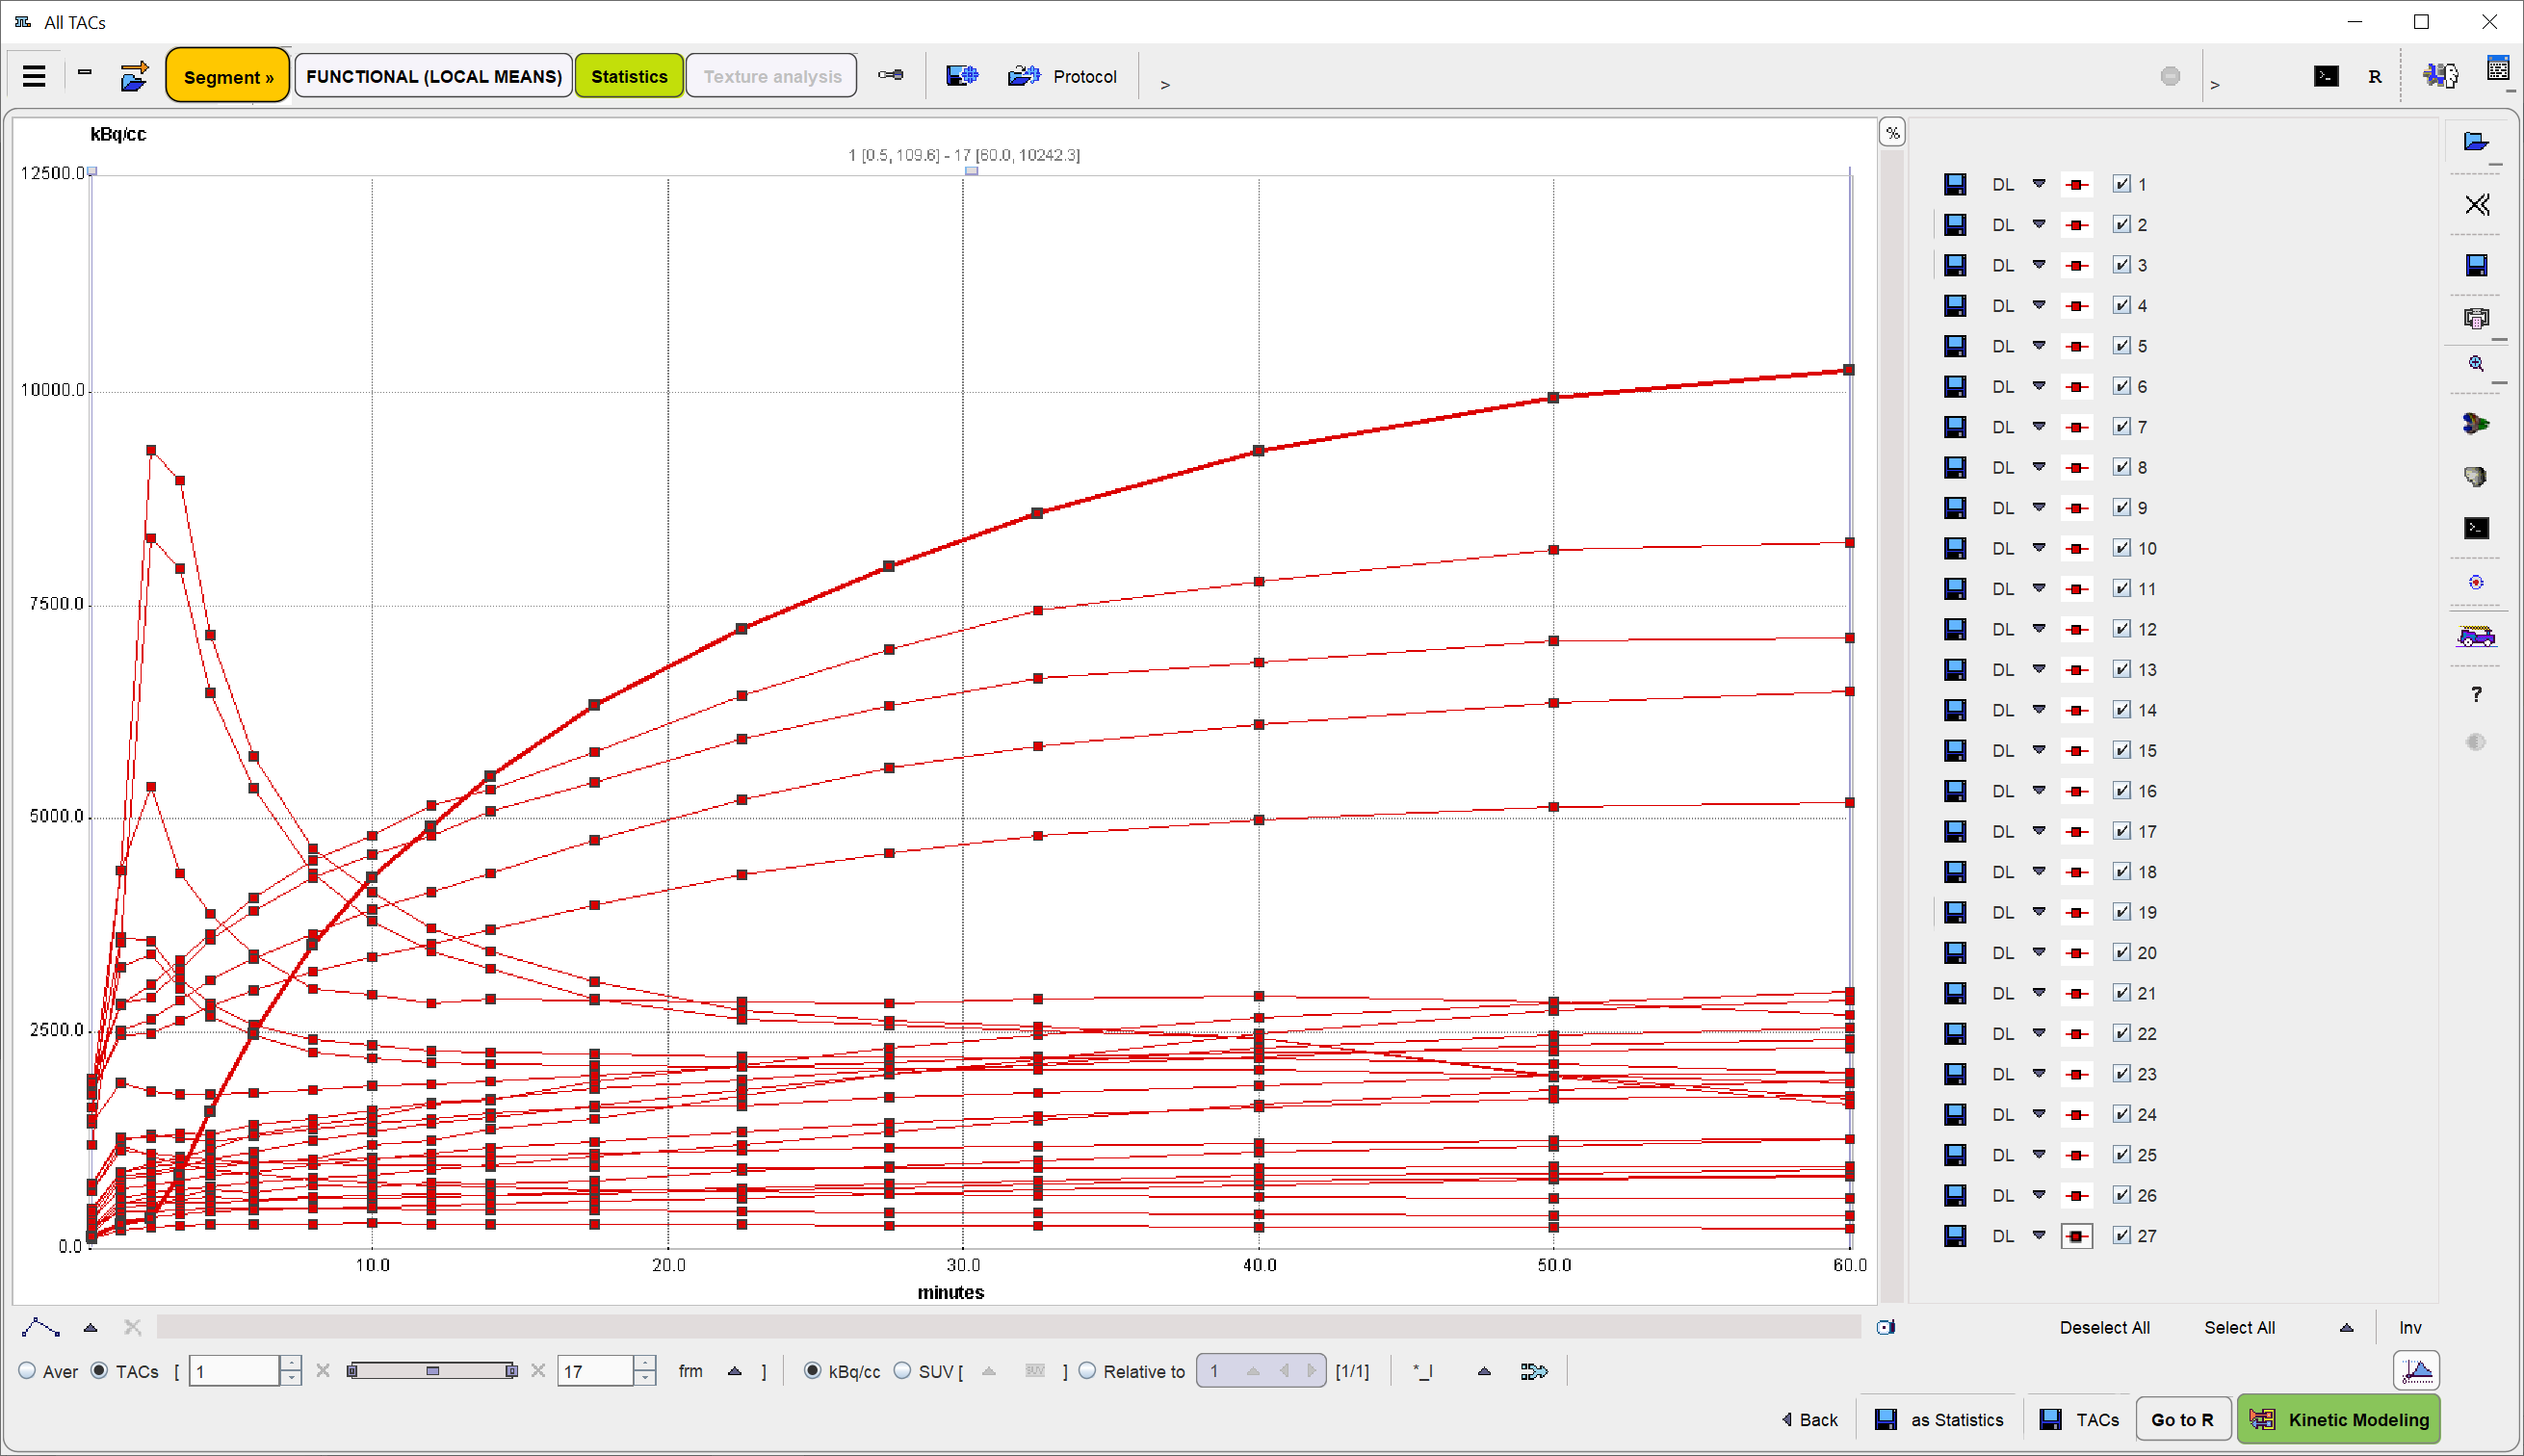
2.The ![]() button in the lower right calculates the TACs of all segments decomposing the body mask at the level defined by the Segment number. The example result with 27 Segment is illustrated below. It provides a convenient overview of the kinetics in the data.
button in the lower right calculates the TACs of all segments decomposing the body mask at the level defined by the Segment number. The example result with 27 Segment is illustrated below. It provides a convenient overview of the kinetics in the data.
3.Normally the Stats action button will be used for producing the end result: The average INPUT (PET in this case) uptake curves in all defined VOIs are calculated and presented on the Statistics page.
Partial-Volume Correction (PVC)
Optionally, the PVC can be enabled for applying .
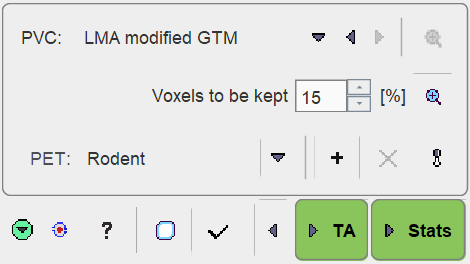
The LMA modified GTM method uses information from the segmentation process. Assuming that the inner-most part of the segments is least affected by the partial-volume effect, it uses only a fraction of the segment data for the segment average calculation. The percentage can be set by the Voxels to be kept parameter. The algorithm uses the Geometric Transfer Matrix (GTM) approach for spillover compensation at a fine segmentation level which is not shown to the user. The corrected signal for all user-assigned segments is then constructed from the corrected signals contained in the segments. The PVC procedure requires that the defined VOIs are non-overlapping. If there is overlap, the results will not be correct.
The resolution of the imaging system is crucial for the GTM method. There is a list-selection for pre-defined scanners in the lower part of the PVC area, and new scanners can easily be added. Default is the generic Rodent scanner with isotropic resolution of 1.5mm FWHM.
With PVC enabled, PSEG will provide both the corrected and uncorrected uptake curves on the Statistics page.