The example below illustrates the result for a dynamic 11C-Raclopride PET/MR example. In this case the statistics is the set of regional TACs.
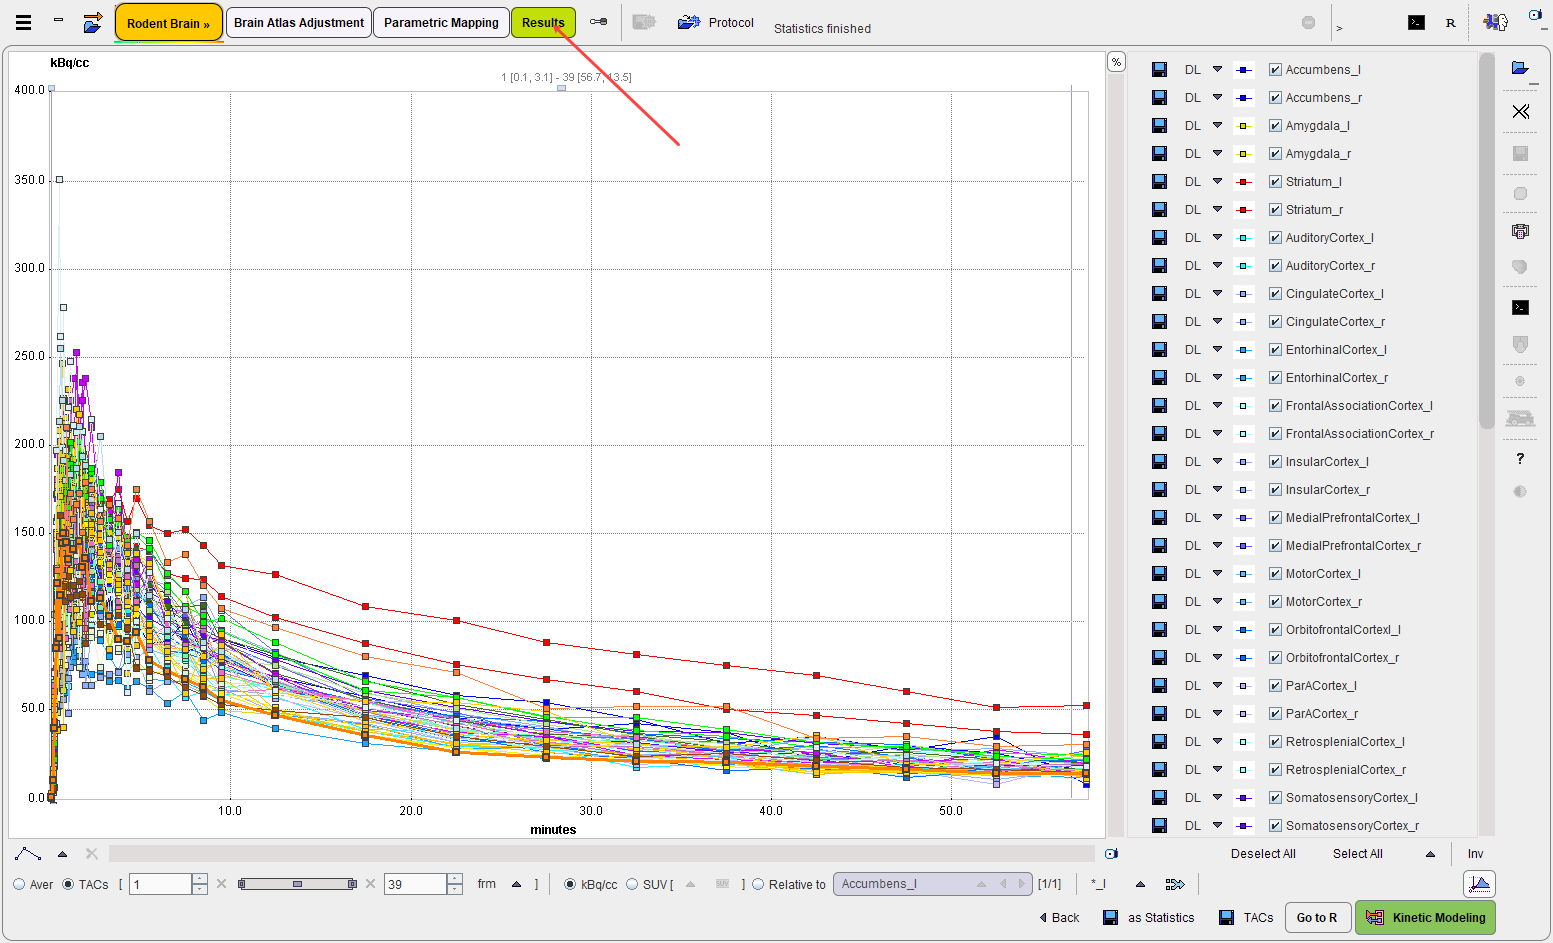
The Back arrow in the lower part is a convenience button for switching back to the PNROD workflow which generated the statistics.
Selection of Curve Subsets
Depending on the atlas, PNROD may create a large number of VOIs. If only a subset is needed for further processing, the checks of the unneeded ones can be removed in the curves list.
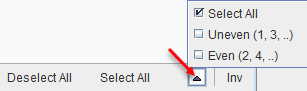
There are some convenience buttons supporting selection in the list: Deselect All switches all curves off. Select All switches all curves on. Inv inverts the current selection. Additionally, there is a list which allows the user to quickly select the even or uneven numbers in the list.
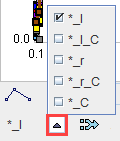
Yet another selection method is available next to the merge button allowing to select curves from the right (_r), the left (_l), or curves resulting after partial value correction (_C).
Note: An alternative reduction mechanism is to select only the relevant VOIs on the VOIs page before calculating the actual statistics.
Transfer of TACs to the PKIN Tool
The Kinetic Modeling button allows dynamic tissue TACs to be directly transferred to the PKIN tool for modeling. It opens the following dialog window.
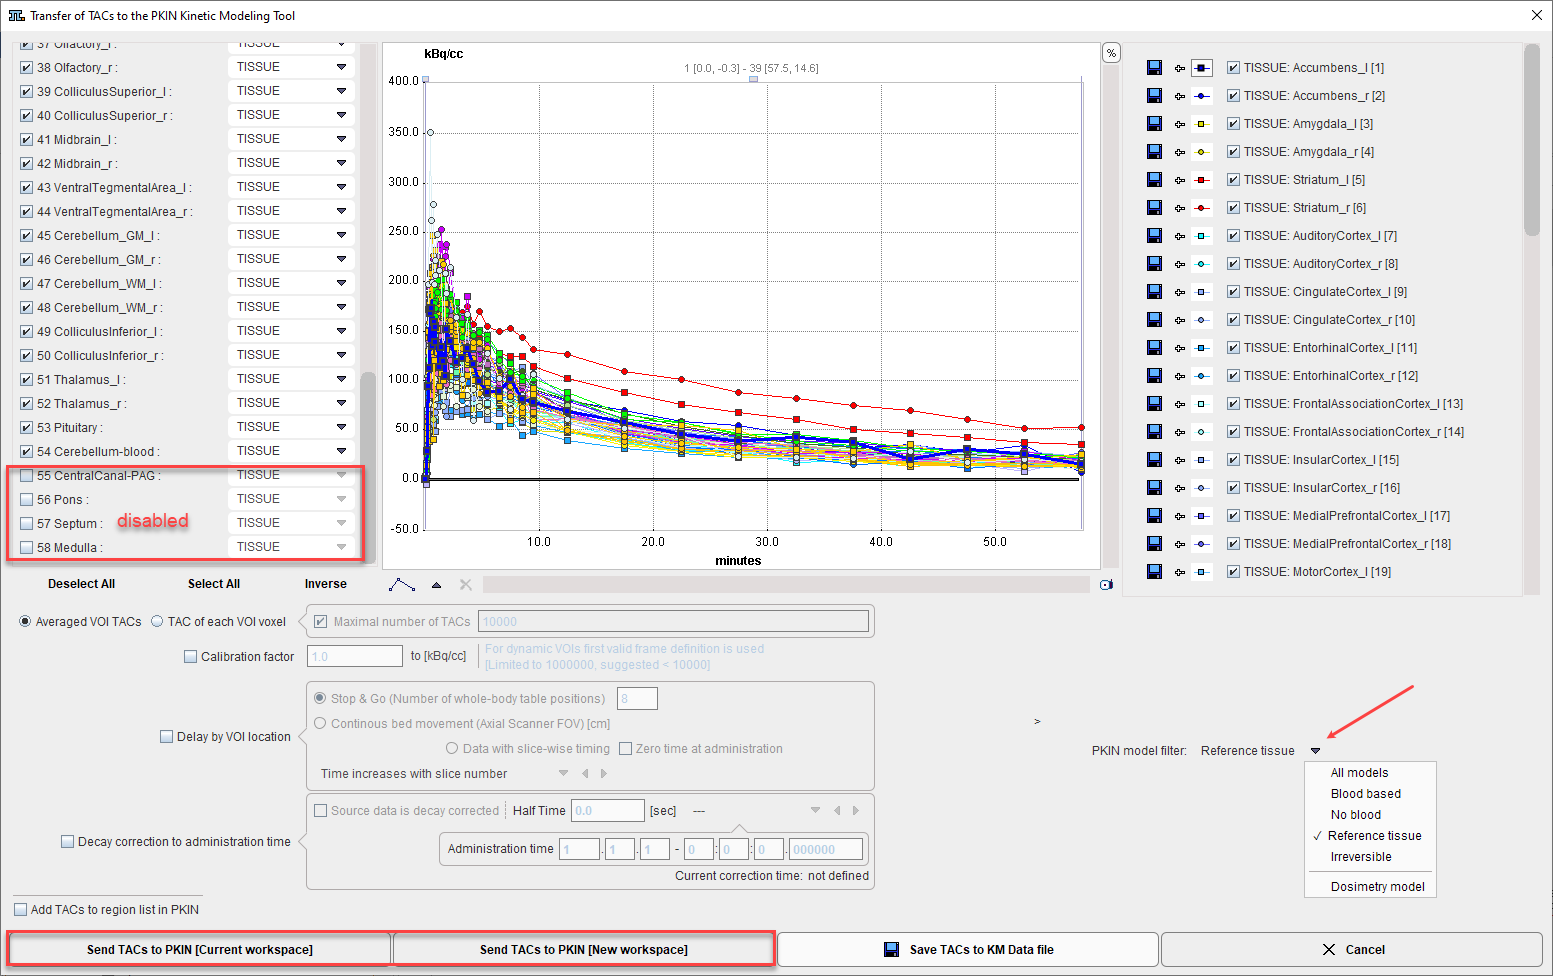
The TACs to be transferred can be selected by checking the box in the left column. The right side lists the currently selected TACs. Send TACs to PKIN [Current workspace] transfers the selection to the active workspace in PKIN. If the Add TAC to region lis in PKIN is enabled, the TACs will be added as additional tissue regions, otherwise the existing tissue data is overwritten. Send TACs to PKIN [New workspace] first creates a new workspace in PKIN before actually transferring the selection.
Save TACs to KM Data file creates a .kmData file ready to be used in the PKIN processing. The PKIN model filter selection is stored in the file.
Saving the Statistics
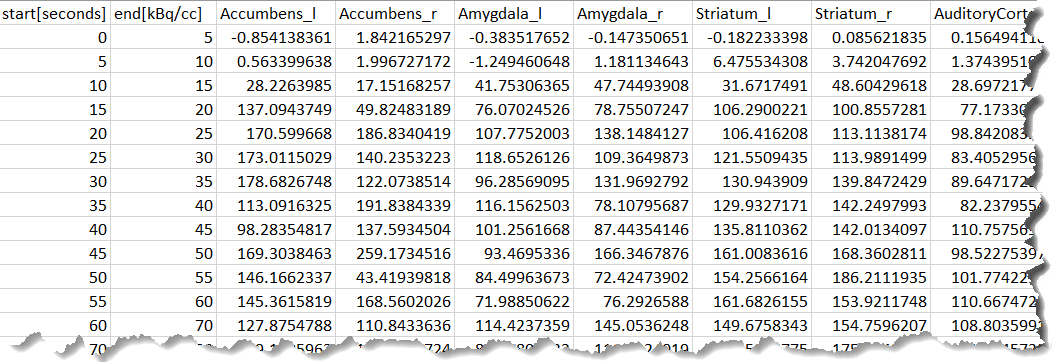
The save TACs button allows saving all curves in a simple tab-delimited text file as illustrated below. Such a file can easily be imported into other programs for processing and visualization.
Save as Statistics button allows storing the information in a different format suitable for statistical analysis.
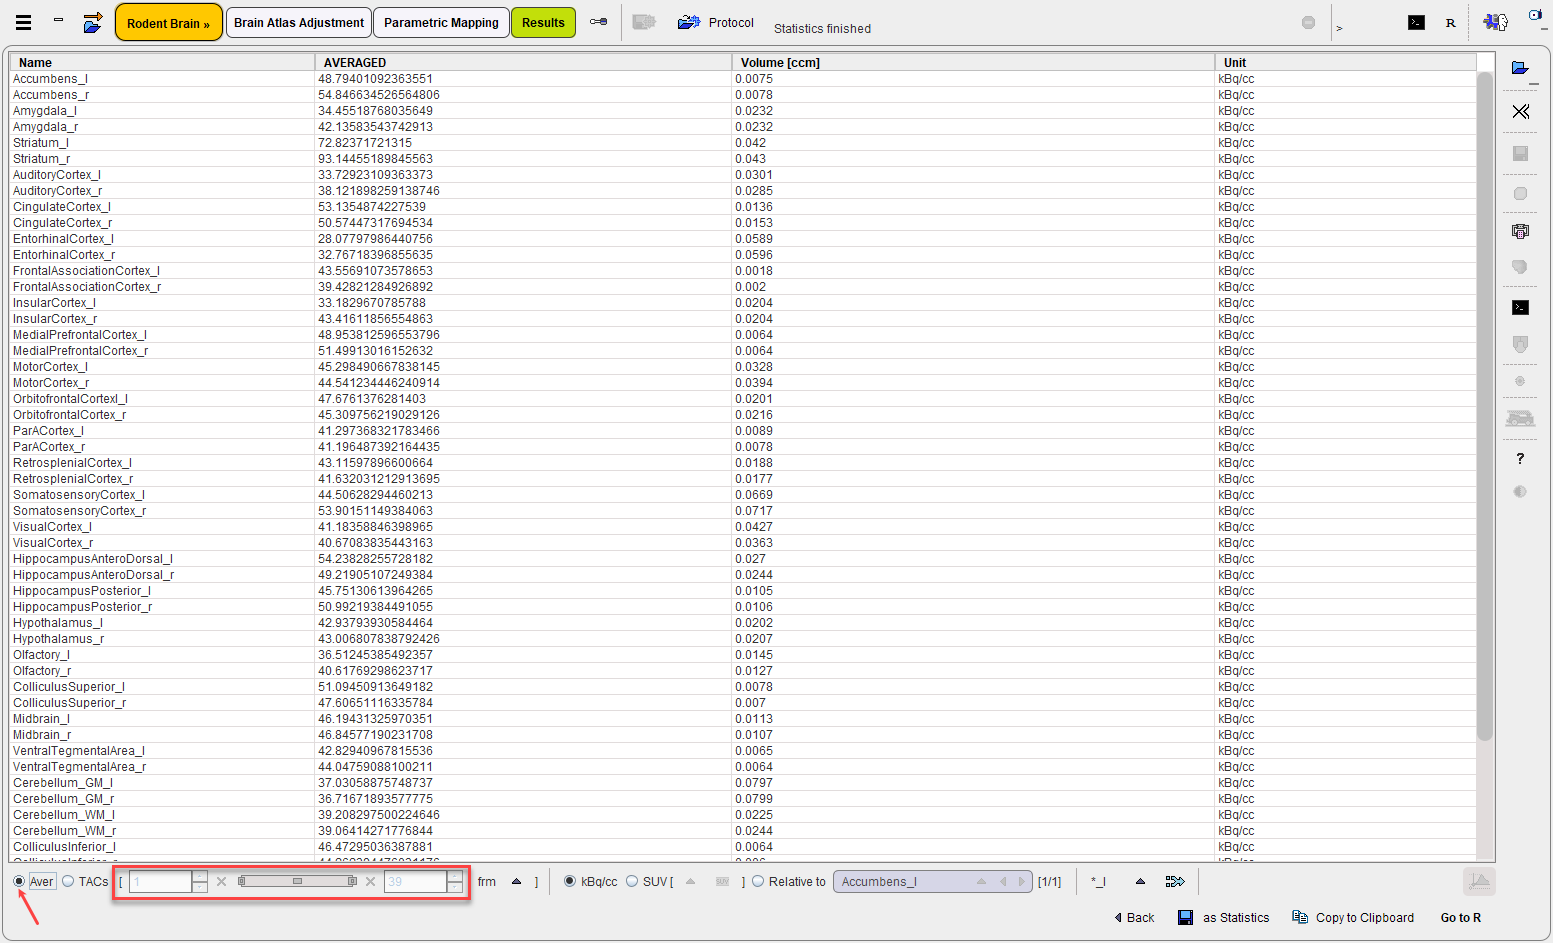
Average in Time Frame Range
For dynamic data there is an easy way to calculate the average regional uptake in the regions in a certain frame range: with the TACs radio button selected define the frame range to be averaged. As soon as the Aver radio button is switched on the uptake statistics is calculated and listed, replacing the curves display.
Averaging of Regional TACs
The Merge (volume weighted) selected VOIs button ![]() allows averaging of selected TACs. When the Selected option is activated a confirmation window appears.
allows averaging of selected TACs. When the Selected option is activated a confirmation window appears.
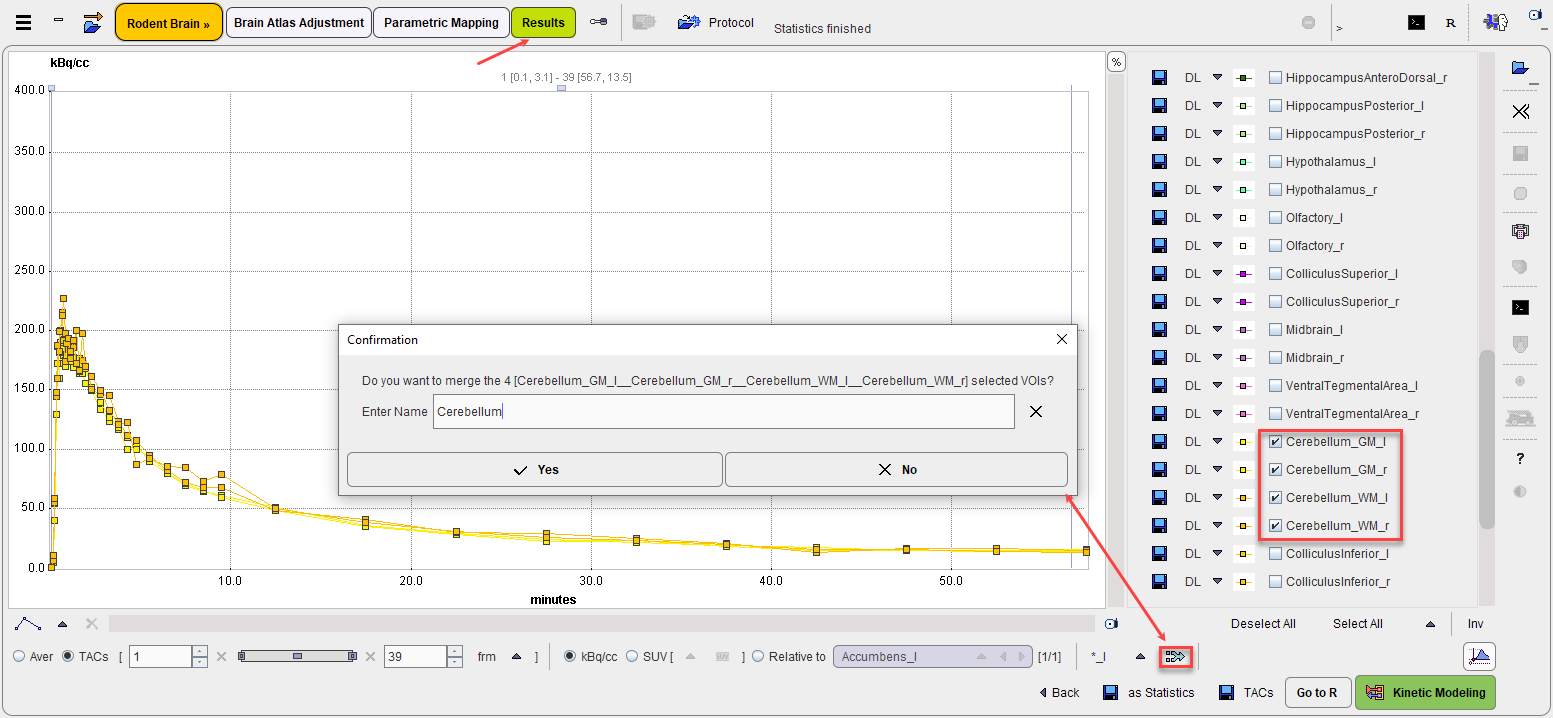
As soon as the Yes button is pressed the new TAC is calculated and appended at the list bottom using the specified name.
Transfer of Statistics to R
The Go to R button transfers the average and volume statistics of the selected TACs to the R server, generating one R variable in the R workspace.