If the pixel-wise modeling tool PXMOD has been licensed, PNROD includes a Parametric Mapping page. An advantage of this integration is that the VOIs generated by PNROD can be used during the PXMOD model configuration, and that the resulting parametric maps can immediately be regionally analyzed using those same VOIs. A further advantage is the choice of image space in which parametric maps will be calculated. For example, the Atlas space may be useful when a group analysis will be performed later, and the Input (original PET) space may be preferred in order to work with the original pixel TACs.
When a dynamic Input image (usually PET) is available, parametric mapping can be performed after the PNROD VOI outlining workflow completed as illustrated below. Please refer to the PXMOD Users Guide for a full description of the process and the models.
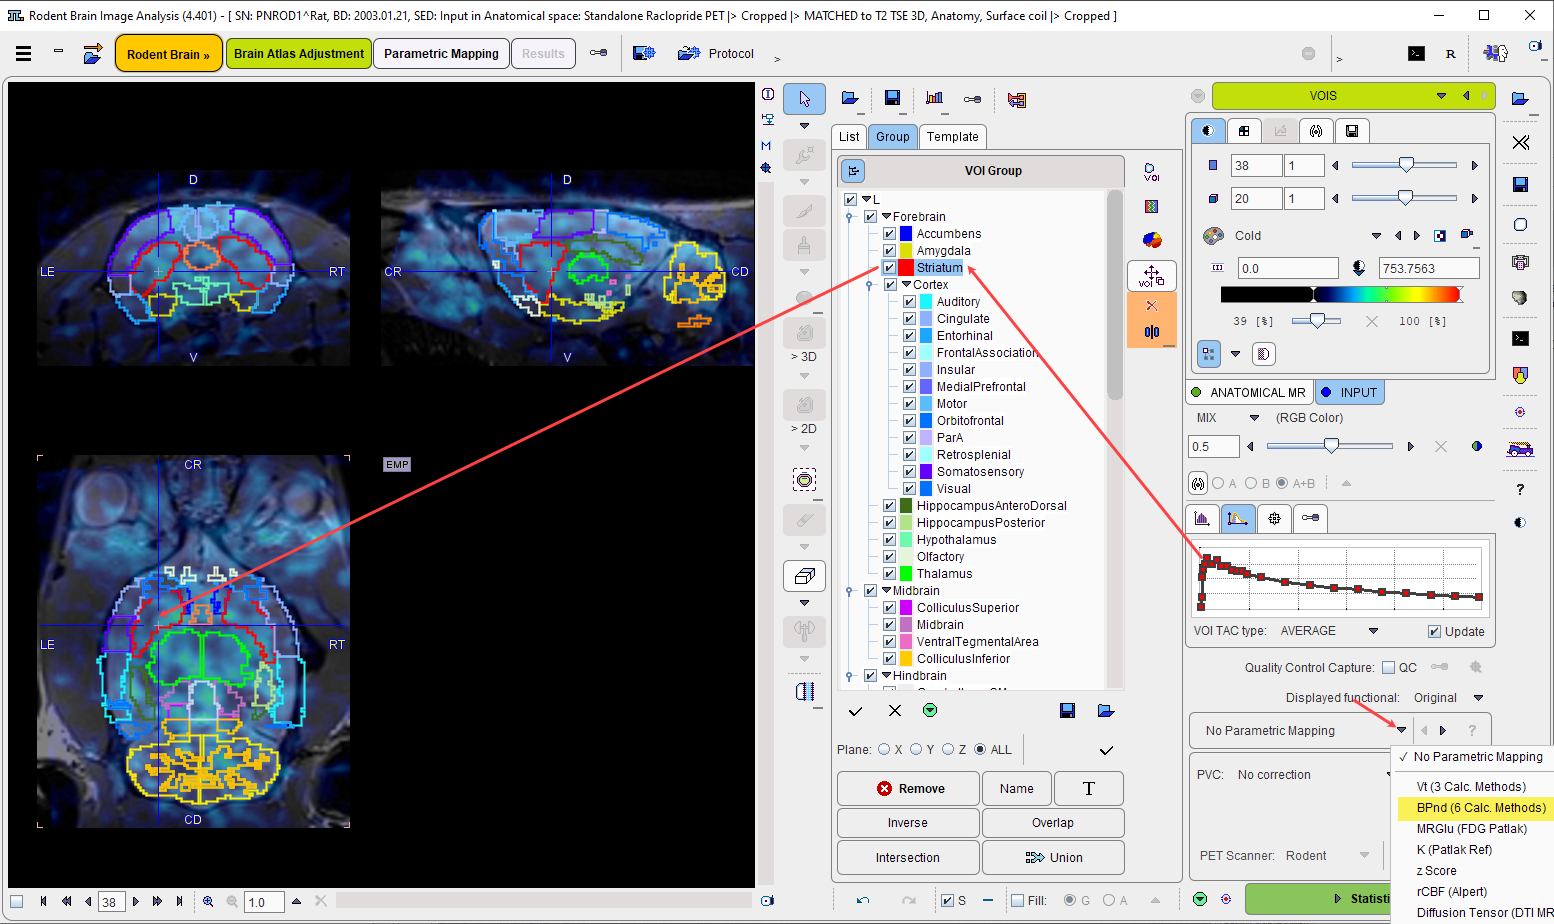
Starting Mapping
The first step is to choose an appropriate model from the list which initially shows No Parametric Mapping. As a consequence of model selection, the Statistics action button is replaced by a Mapping button.
When activating the Mapping action button, a model-dependent configuration window is shown. The example below illustrates the case of mapping the binding potential with the BPnd (6 Calc methods) model.
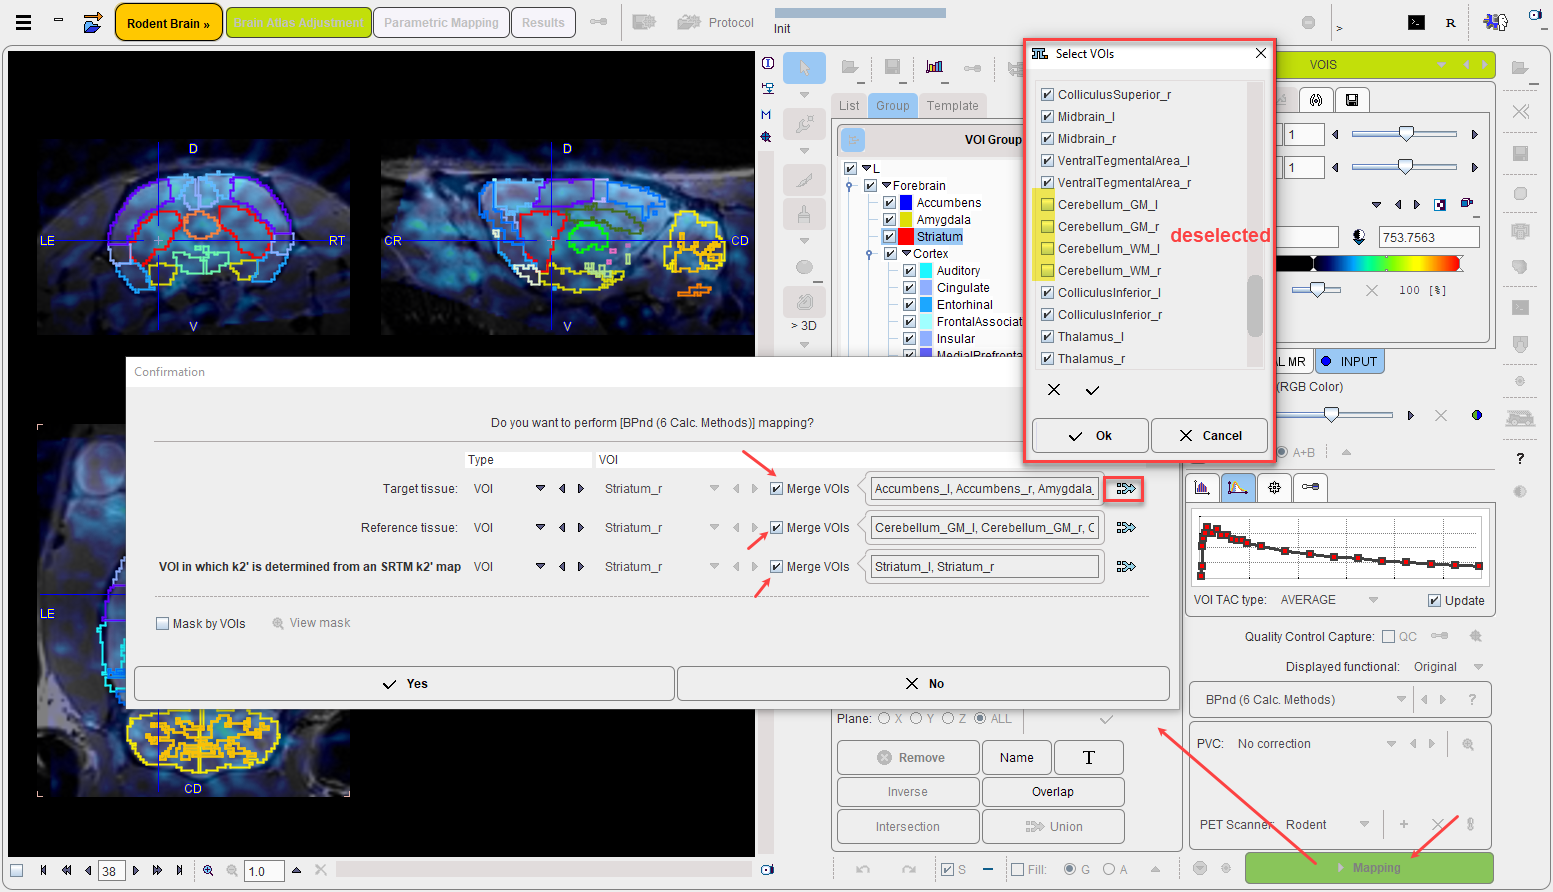
It requires two tissue time-activity curves for a preprocessing step, one representing a Target tissue region, the other a Reference tissue region. There are three ways how to specify them: FILE, VOI and TAC(DB).
VOI is the obvious choice, as the PNROD-generated VOIs can be employed. Either a VOI can be selected from the list, or the Merge VOIs option can be enabled in order to create a VOI from a subset of the existing VOIs. There are two ways to define a VOI subset: (1) by the specification of a comma-separated list of VOIs or a pattern such as Cere* in the text field (selects all VOIs with a heading "Cere" in the name), or (2) by selecting the merge button ![]() indicated above. With the latter, the selected Selected button shows a dialog window within which any VOI combination can be defined.
indicated above. With the latter, the selected Selected button shows a dialog window within which any VOI combination can be defined.
The Mask by VOIs option allows the user to restrict the mapping procedure to pixels within the VOIs. This may substantially reduce the time needed for map calculation, and allows non-specific tracer uptake outside the brain to be ignored. On the other hand, the gaps in the image may be appear unpleasant. The View mask button opens a dialog window with a mask preview.
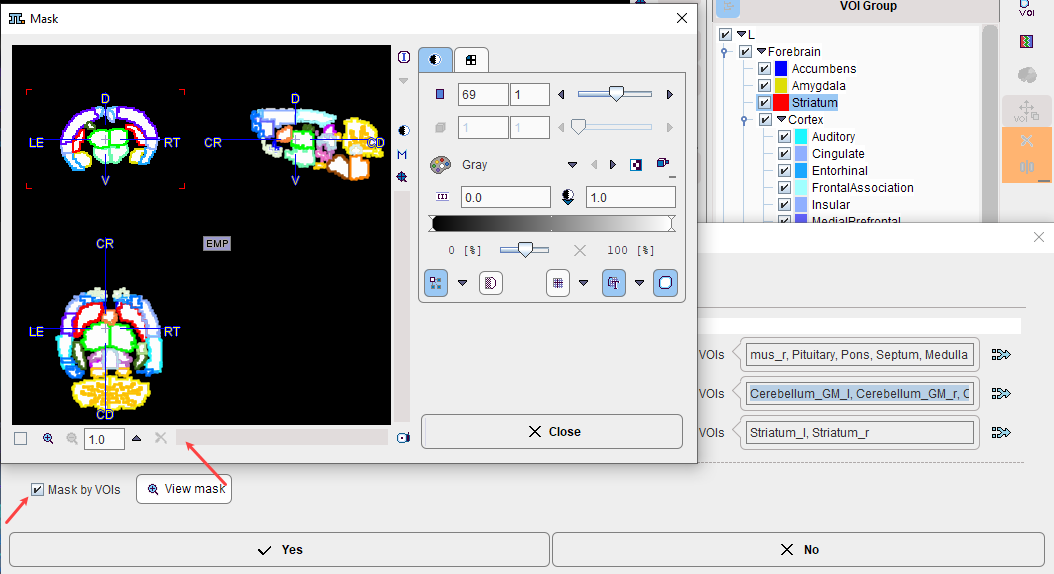
Note: Mapping is performed in the selected result space and can take much longer in a highly-resolved MR space than in the PET space.
PXMOD Workflow
After confirming with Yes the program enters the Mapping page which hosts the PXMOD functionality. In the following the workflow is briefly captured. Please refer to the PXMOD Users Guide for the modeling-related explanations.
In the example below mapping starts on the Model Preprocessing page, because there is no blood data involved. Note that the VOI definitions are already configured according to the definition provided by the user in the previous dialog window.
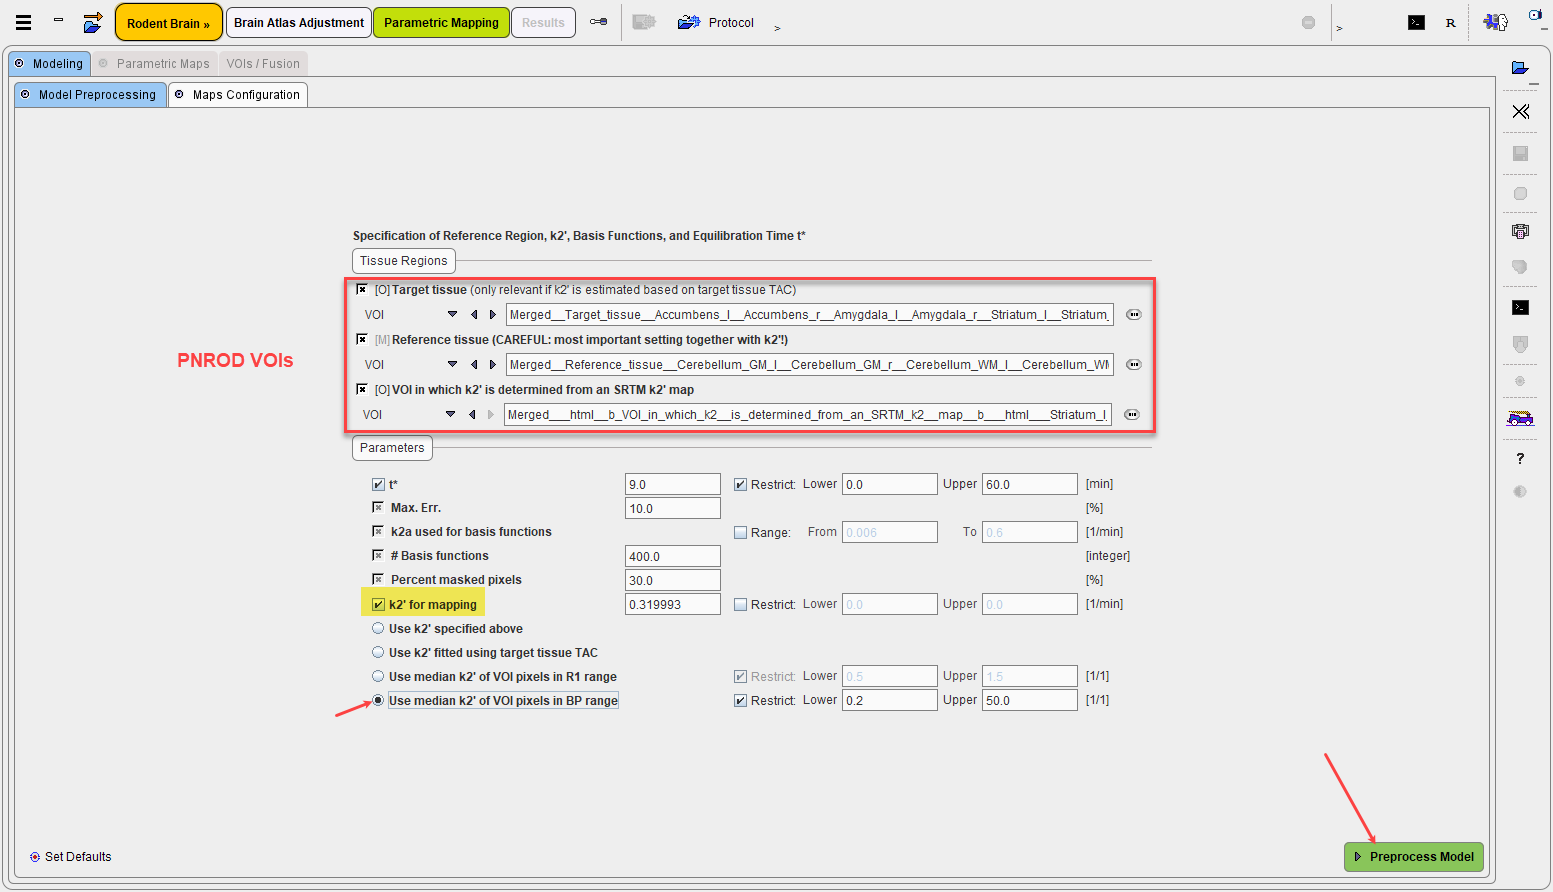
Preprocess Model starts the modeling preparations and displays the results on the next panel. Note that because the scale of the Logan plot is different from the original data, the tissue TACs have been switched off manually in the illustration below.
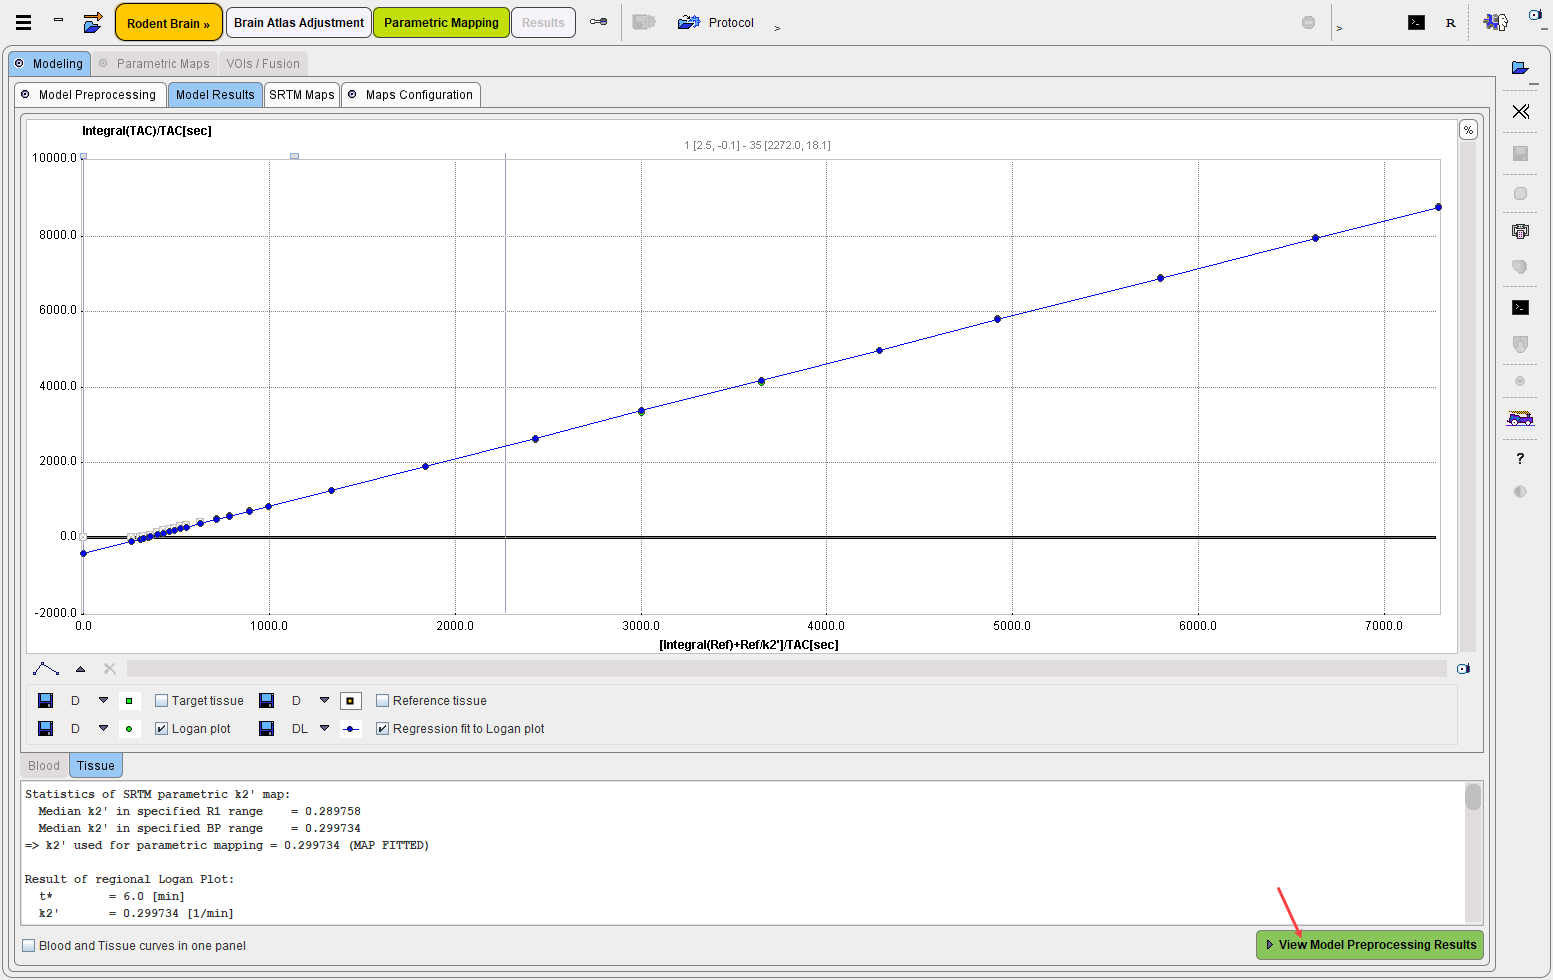
The selected model generates an additional result panel, which is shown on the next panel when proceeding with View Model Preprocessing Results. It displays the parametric maps for the VOIs structures configured in the first mapping step as VOI in which k2' is determined from an SRTM k2' maps:
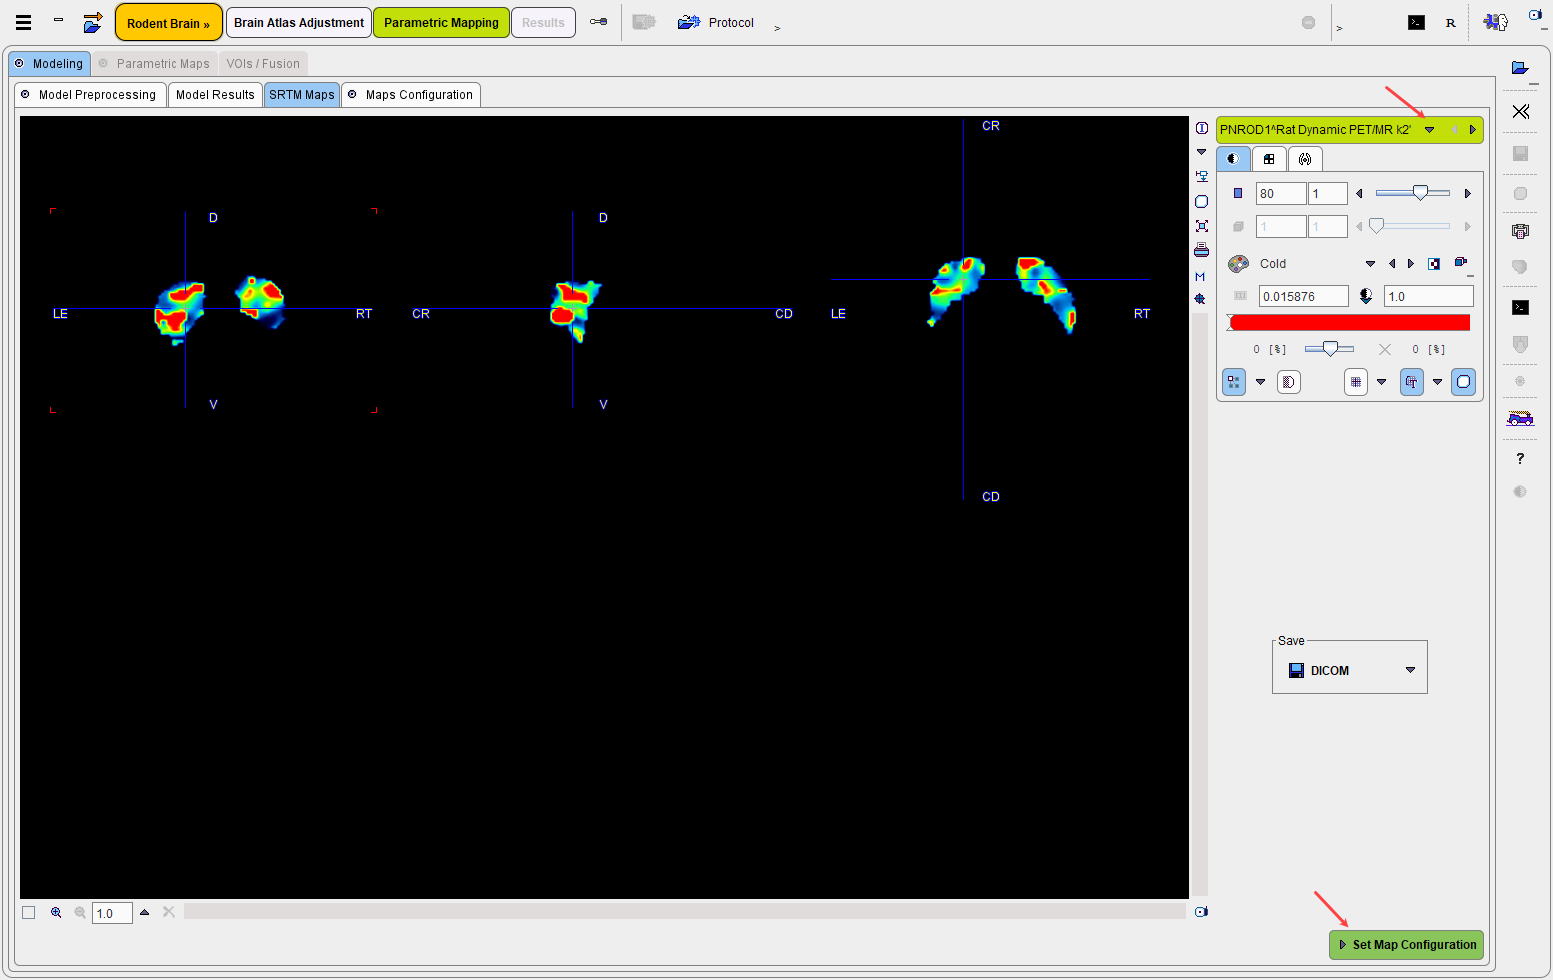
Set Map Configuration proceeds to the Maps Configuration panel for defining the target parametric maps and their physiologic boundaries.
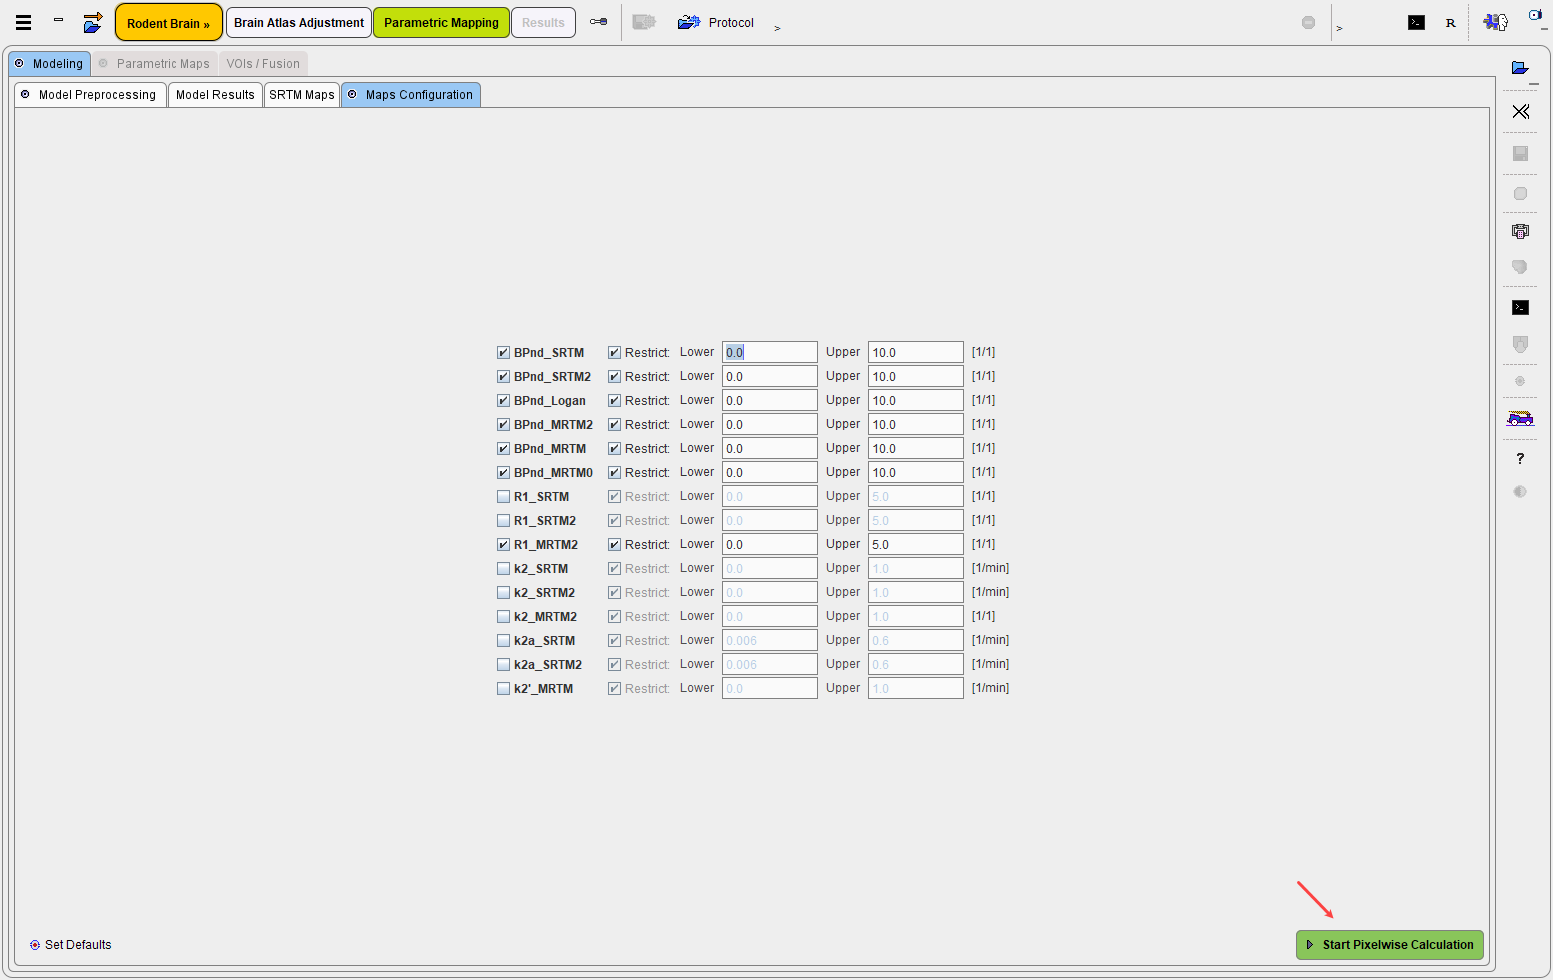
Start Pixelwise Calculation initiates the actual kinetic modeling in every pixel and shows the result on the Parametric Maps panel.
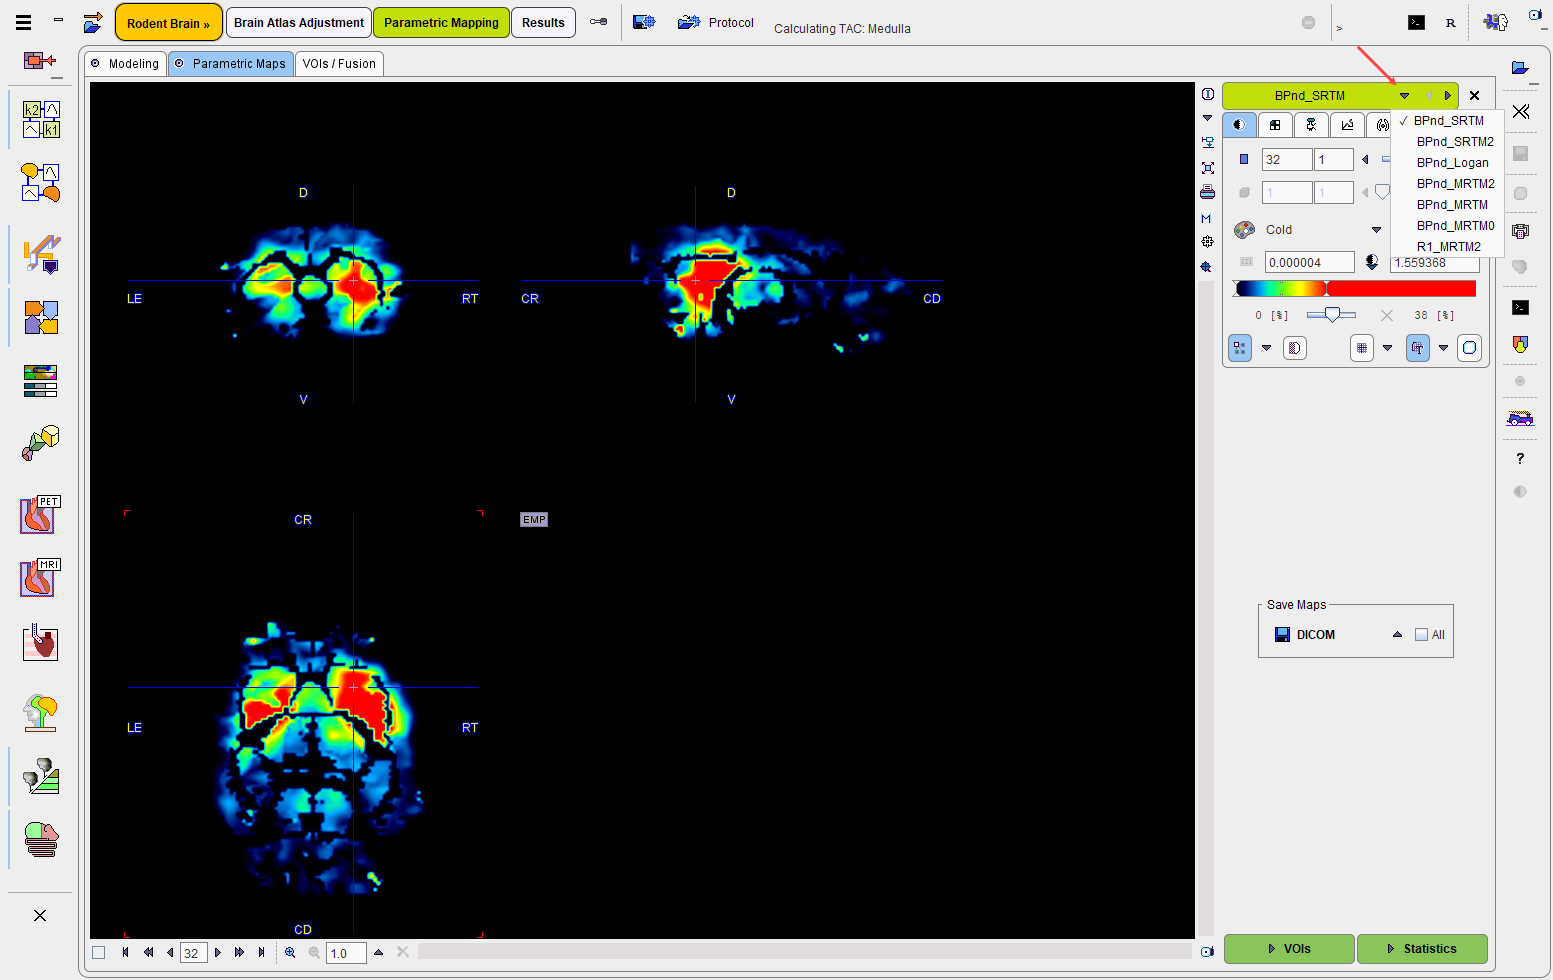
Evaluation of the Parametric Maps
The VOIs action button opens the VOIs/Fusion panel which shows a fusion of two resulting parametric maps as well as the VOIs in the overlay.
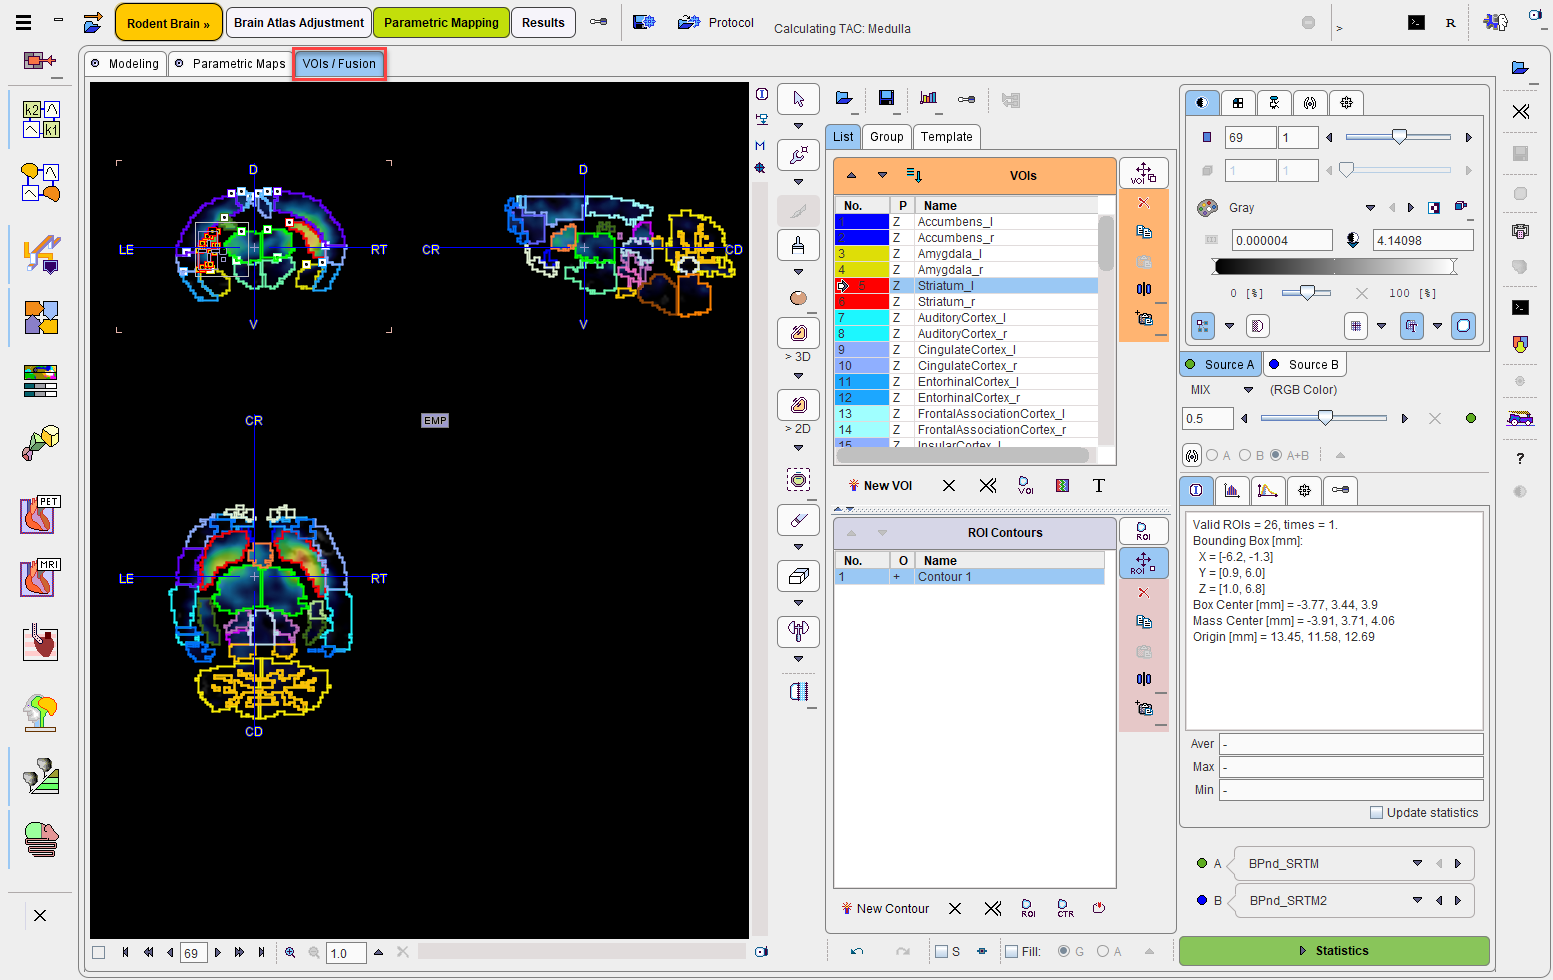
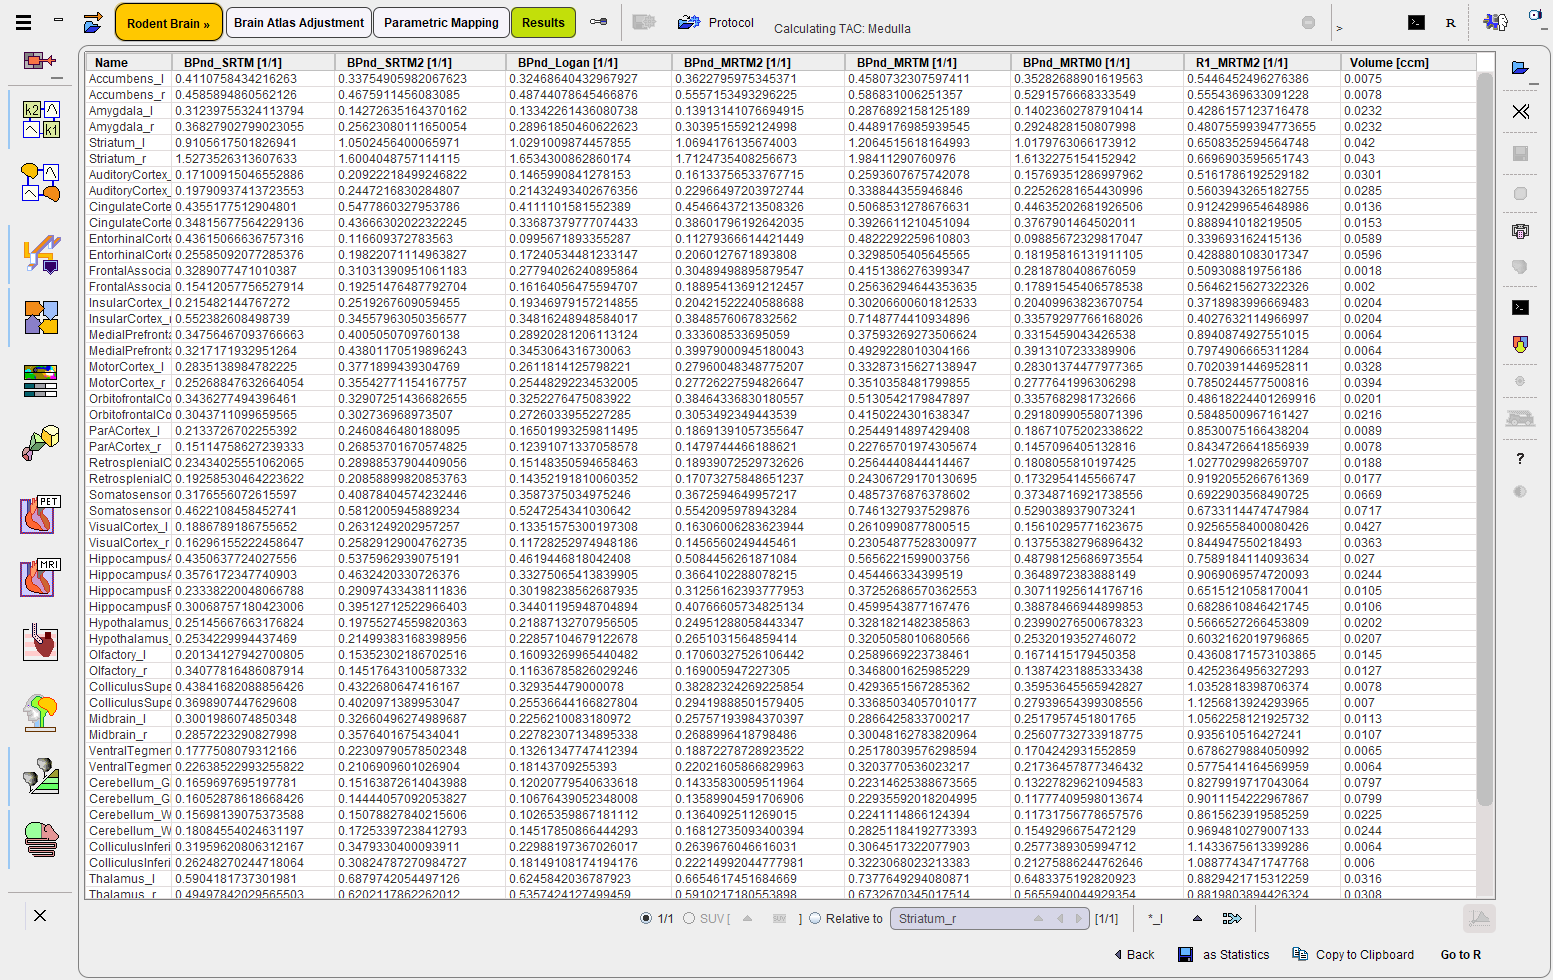
The Statistics action button calculates the regional average of all VOIs in all parametric maps and shows the resulting table in the main Results statistics page. Note also the last column which lists the VOI volumes for convenience.
Note: If parametric mapping should be part of the protocol, page Parametric Mapping must be active when saving the protocol.