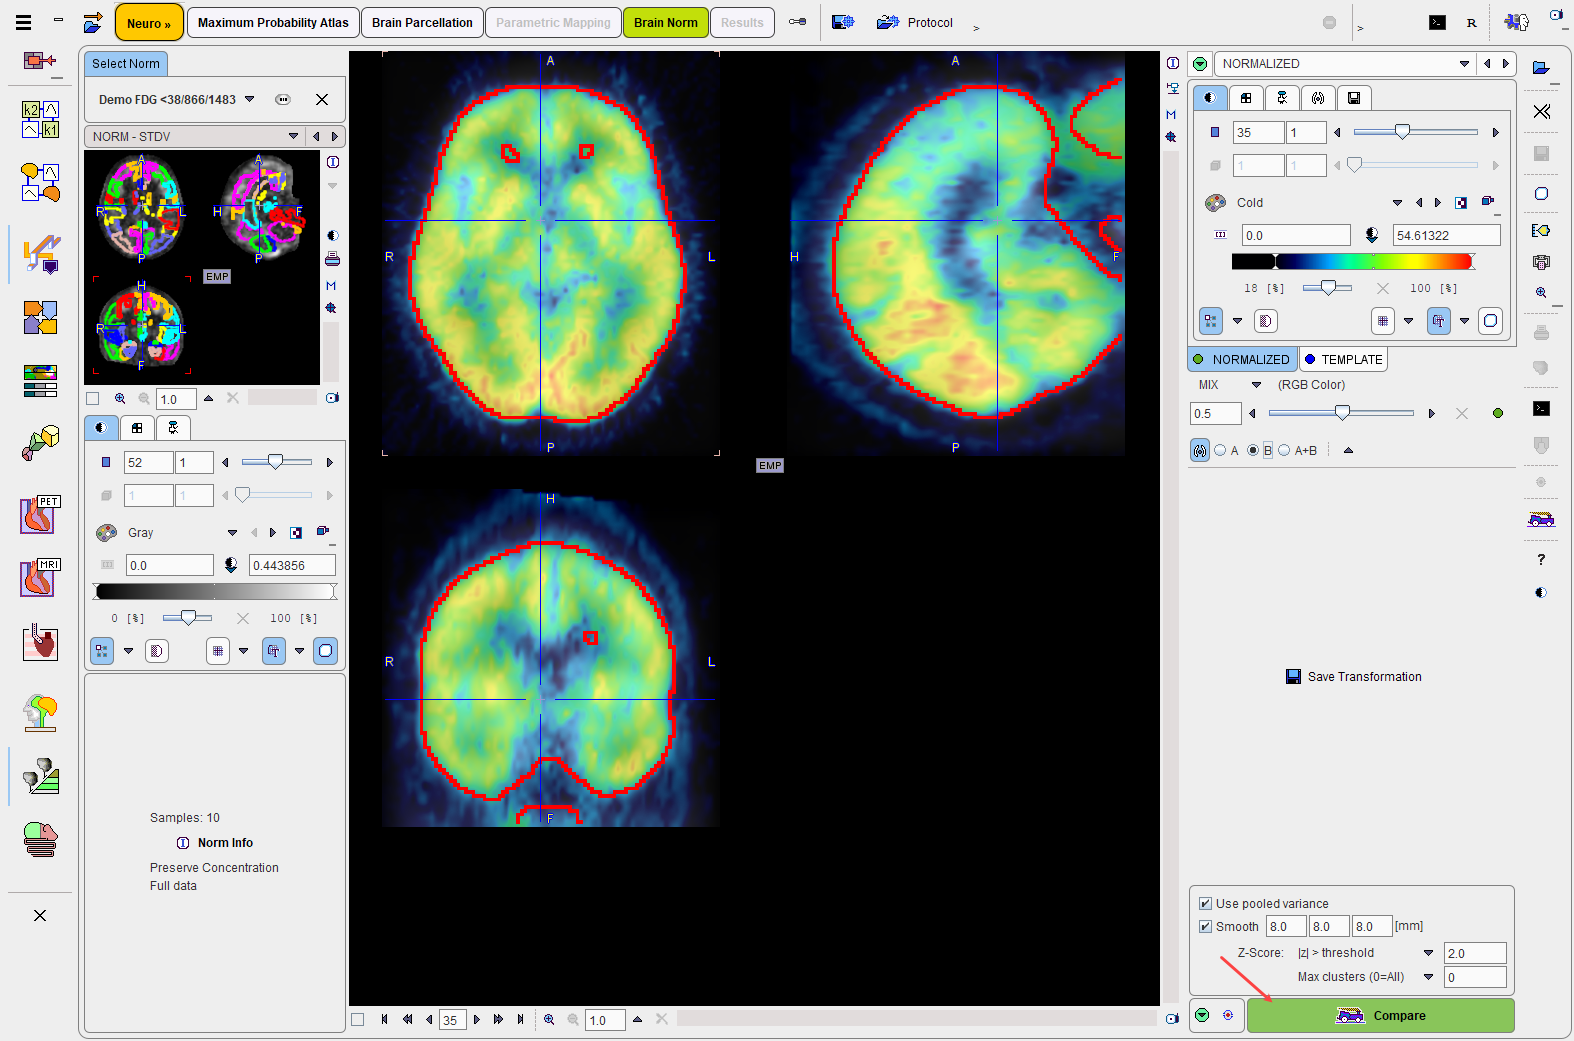
The result of the normalization is shown on the NORMALIZED page as a fusion of the normalized subject image with the template image.

The purpose of this page is to verify that the anatomical agreement in both images is sufficient. To this end it is recommended moving the fusion slider left/right, enable the iso-contours, and clicking at different brain locations.
The area in the lower right serves for configuring and starting the z-score calculation. The initial configuration is derived from the Brain Norm, but it can be modified according to the current image quality. If the size of the control group is small, the Use pooled variance box should be checked to use a single averaged standard deviation value for all pixels. Otherwise, the individual pixel-wise standard deviation determined will used. A Gaussian Smoothing filter should be applied to the normalized images before comparing them with the Brain Norm, because the reference was obtained by smoothing and pooling. It will be a matter of some optimizations to determine the filter parameters which bring both data sets to about the same resolution.
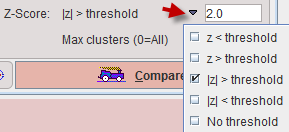
A z-score map will be calculated for each pixel of the result mask. This z-score map can be restricted to values in a certain range by the Z-Score selection.

With z< threshold, only pixels with z-scores below the entered threshold value will be retained, whereas the value in the other pixels is set to zero. The typical setting is |z|>threshold to retain pixels which deviate from the normal value by 2 standard deviations. With No threshold the z-score value in all pixels is retained.
The filtered results may be restricted with respect to connected cluster size. There are two ways to specify this filter.

With Max clusters the result can be restricted to the number of largest clusters specified. No filtering is applied for the value of 0. With Min size only clusters with the minimal number of pixels specified will be shown.
Calculation is started with the Compare button.