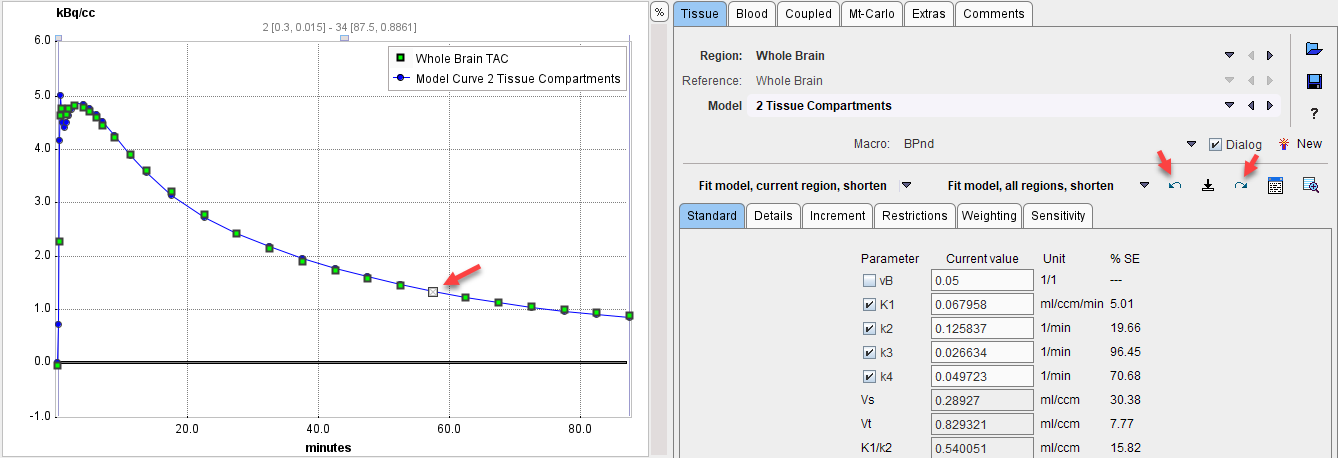
A standard task when analyzing kinetic data of a new tracer is to assess the dependence of the parameters on the length of the available data. This type of analysis can easily be performed using the Data shortening option on the Extras panel.
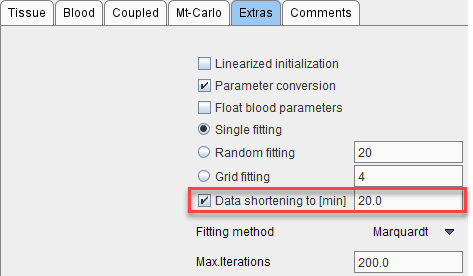
As soon as this option is enabled with a minimal data duration, the fit buttons are labeled accordingly

When activating Fit model, current region, shorten the following happens:
1.The set of initial parameters is created.
2.A fit is performed with the minimal data segment (e.g. the first 20 min), corresponding to a small number of Degrees Of Freedom (e.g. DOF=16). All other fit options on the Extras panel are also active.
3.An additional sample is added to the data segment and the fit repeated with the same initial parameters (DOF=17).
This step is repeated until the full data segment has been fitted.
Results
The results are stored in the model fitting history and can be opened with the  button. All sensitivity fits have the same Revision number. The data segment length is represented by the DOF column (dragged from the far right). In the curve plot the unused samples at the end are indicated in gray.
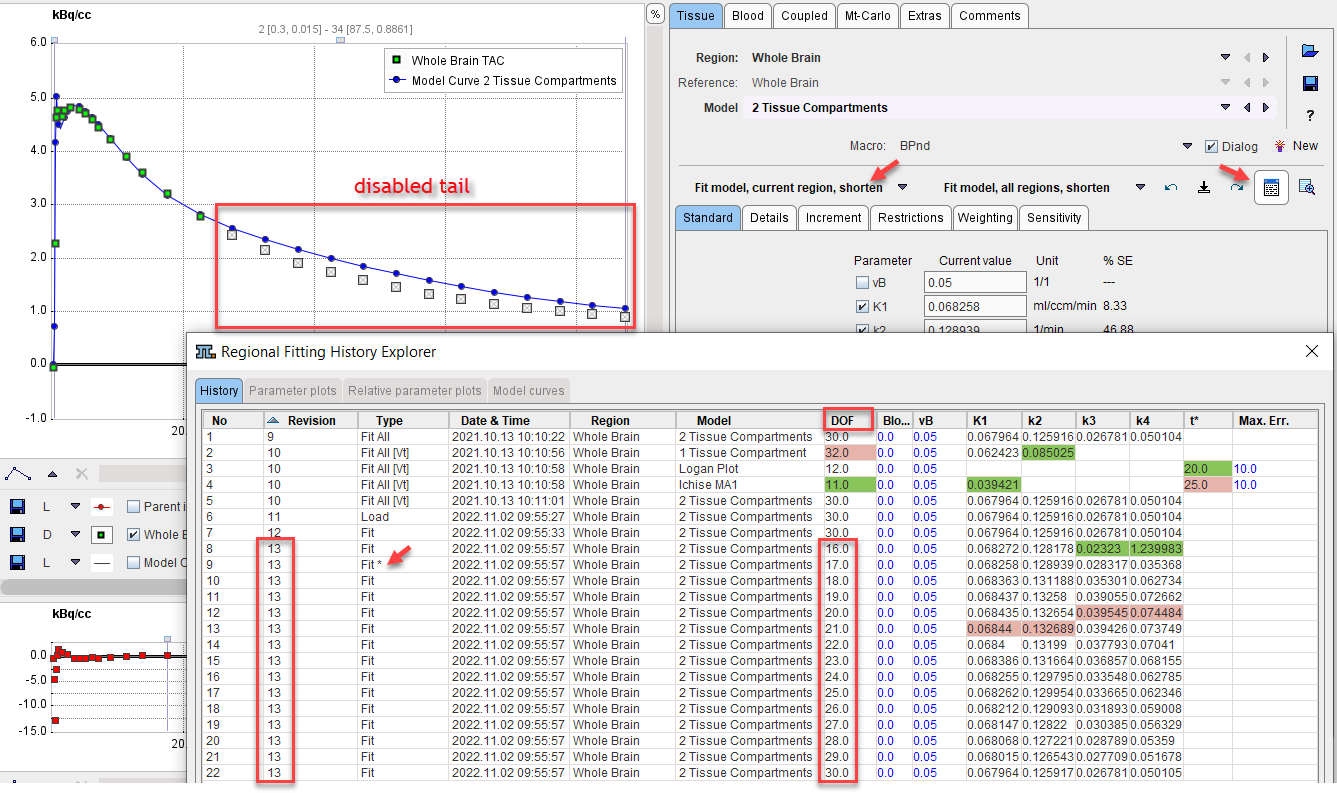
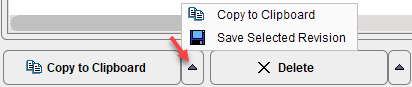
The results of the sensitivity analysis are most conveniently saved by selecting an entry with the appropriate Revision and using the Save Selected Revision function illustrated below. It saves the fitting results from all regions into a .kinPar file.
Sensitivity Visualization
A visual impression can be obtained by stepping through the fitting history with the forward and backward buttons

and observing the shape of the model curve as the number of included samples changes.
For a visualization of the parameters the results can be exported via Copy to Clipboard, but the trend can also directly be visualized on the two panels Parameter plots and Relative parameter plots. The selection in the history list defines the data to be visualized:
•Selection of a single line in the fitting history: all entries with the same Revision number are used.
•Explicit selection of a subset of lines: only the selected data is used.
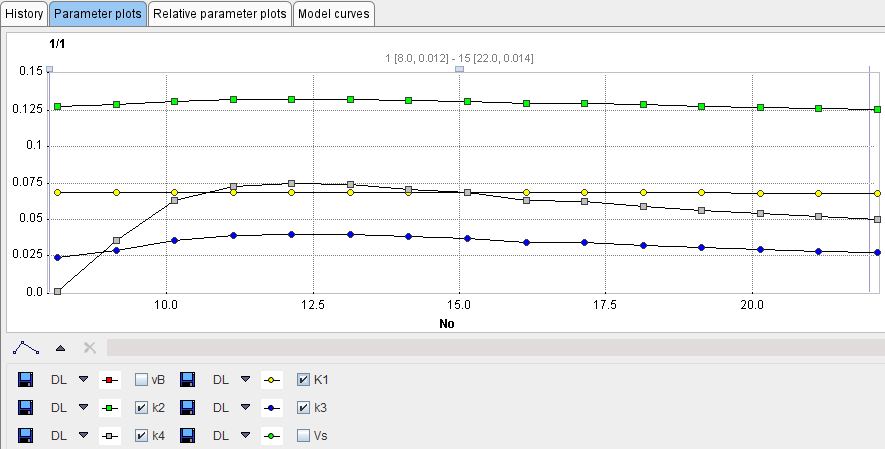
When selecting the Parameter plots panel the absolute parameter values are visualized. Each parameter corresponds to a curve and can be enabled/disabled with the checkboxes in the curve control area. The x-axis value corresponds to the number in the No column, so the length of the data segment increases to the right.
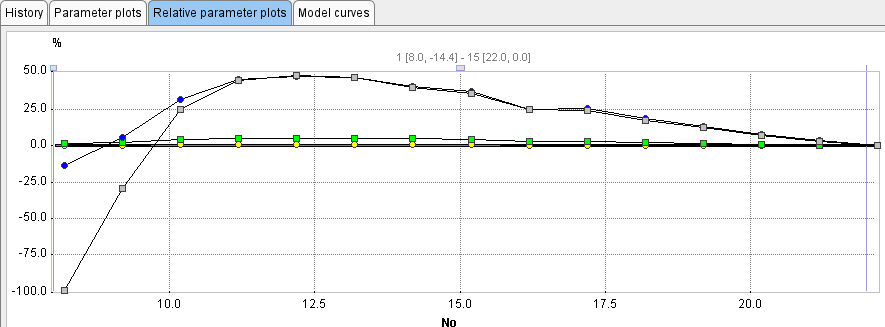
When selecting the Relative parameter plots panel the same curves are shown, but the values are normalized to the last point (which in the case of the sensitivity fitting can be considered as the most reliable one).
Leave-one-Out Analysis
The shortening operation behaves differently, if a negative Data shortening to time is specified.
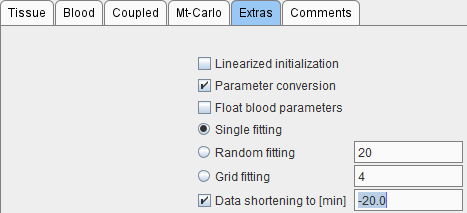
In this case, not the whole end segment at the end is disabled, but only a single point, as indicated below. Using the model history, the user can easily step through the different fits with a single measurement disabled and see the impact on the result parameters.