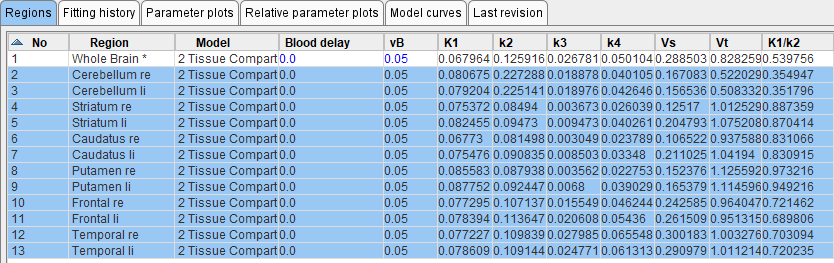
A convenient overview of the models and their parameters can be obtained using the Study-wide parameter explorer illustrated below. It shows a similar dialog window as the Fitting History, with the Region list entries corresponding to the different regional TACs of the data set.
Note: The results shown on the Regions tab depend on the configuration settings. After changing the configuration, the window has to be closed and re-opened.

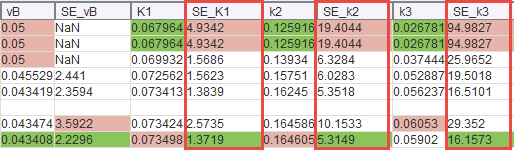
The column maximum is highlighted in red, the minimum in green. Values can be sorted by clicking into the column headers, and the parameter order changed by dragging the column headers left/right. Data export is facilitated via Copy to Clipboard.
The Last revision panel shows the entries of the last fitting operation. It is most useful for Macro Results Inspection. It will only show a single line after fitting an individual region, and the same information as the Regions panel after fitting all regions.
Configuration Settings
The configuration button opens a dialog for defining the information to be displayed.
Include standard error (%SE) in table |
For each model parameter add a column with the % standard error. |
Include distribution statistics at table bottom |
Show the lower section with min/average/median/max/stdv. |
Use last region fits for table |
Show the last successful fit from the history for each region. Otherwise the current regional model configuration will be listed, whether fitted or not. |
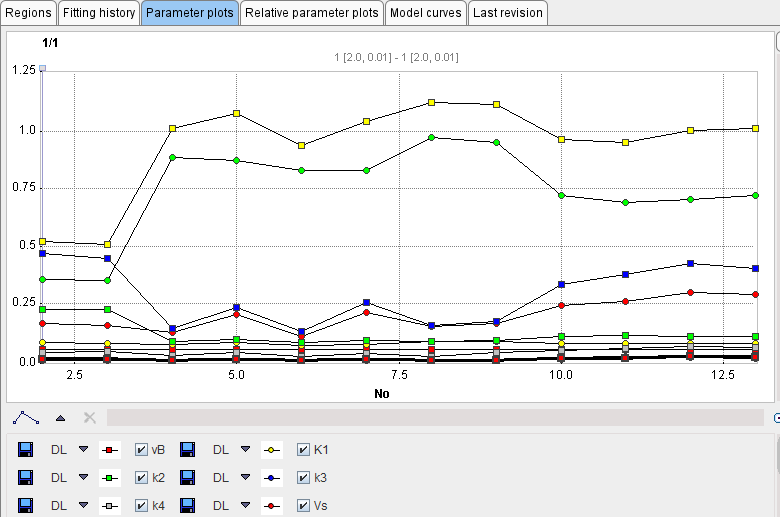
Display tab with parameter plots |
Visualization of the parameter values as a curve. Select the regions of interest on the Parameters panel.
The parameter plots are then shown on the Display parameters panel. Note that the instead of the region names their number in the list is used along the x-axis.
|
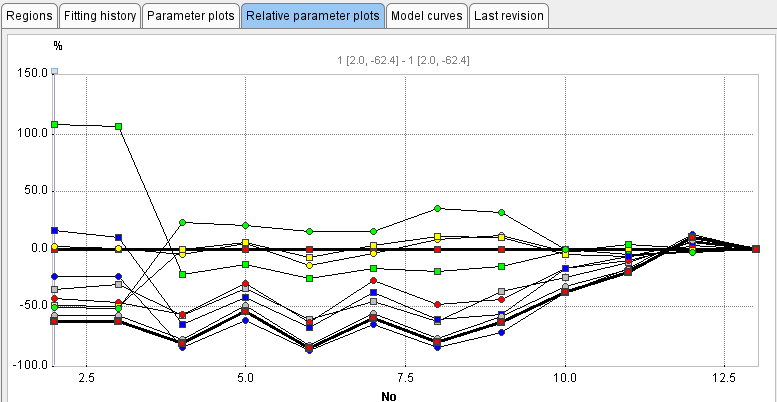
Display tab with relative parameter plots |
Visualization of the normalized parameter values as a curve. Select the regions of interest on the Parameters panel. The Display relative change curve panel then shows the plot of each parameter normalized to the value of the last region.
|
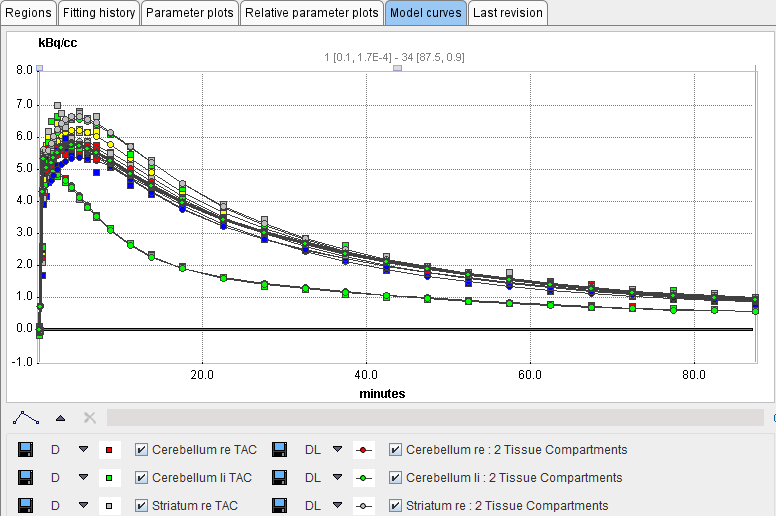
Display tab with model curves |
Visualization of multiple regional TACs together with their model curve. Select the regions of interest on the Parameters panel. The Display model curve panel then shows the data and the models.
|
Region filter |
Specify a string (e.g. *right*) to filter the region list. |
Model filter |
Specify a string (e.g. *Compart*) to filter the model list. |