With rare exceptions only a fraction of the tracer in blood is exchangeable with tissue and thus needs to be determined from blood aliquots which are withdrawn from an artery during the whole study. This process is highly crucial for the quantification outcome. Please refer to our application note for a thorough discussion of all required processing steps and potential pitfalls.
A whole blood sample comprises tracer in the red blood cells and different tracer categories in the plasma: free unchanged tracer (parent), tracer bound to plasma proteins, tracer chemically changed by metabolite processes (metabolites). Depending on the tracer ligand, exchange processes are continuously going on between the different tracer pools in blood.
Blood Sample Analytics
The following blood analysis steps are required in quantitative PET studies to determine the concentration of unchanged tracer in plasma as the Arterial Input Function (AIF).
1.Separation of the plasma from the red blood cells by centrifugation.
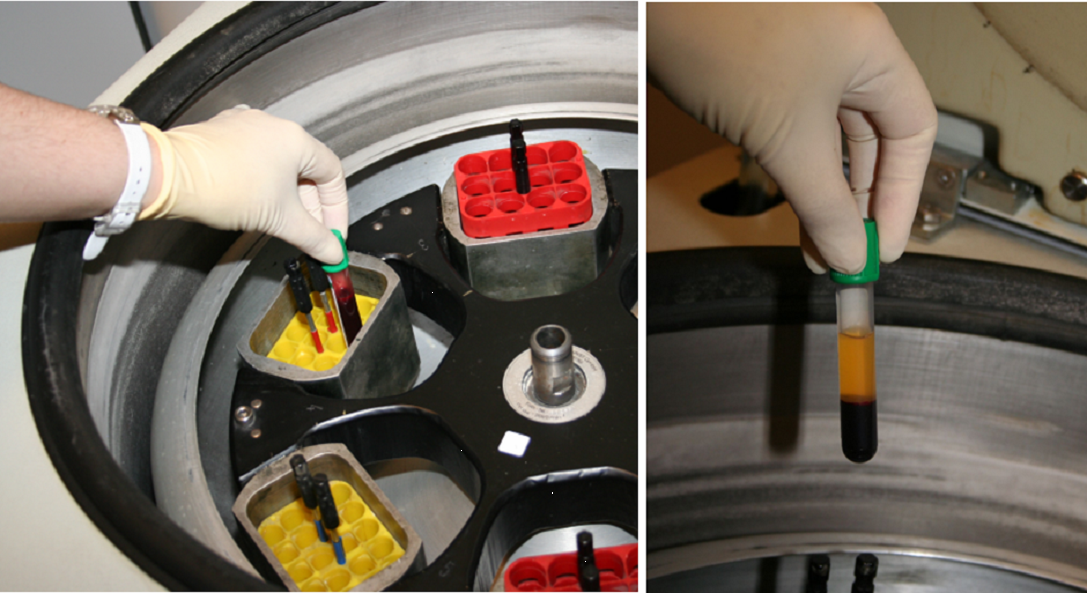
Plasma represents about 60% of the total blood volume.
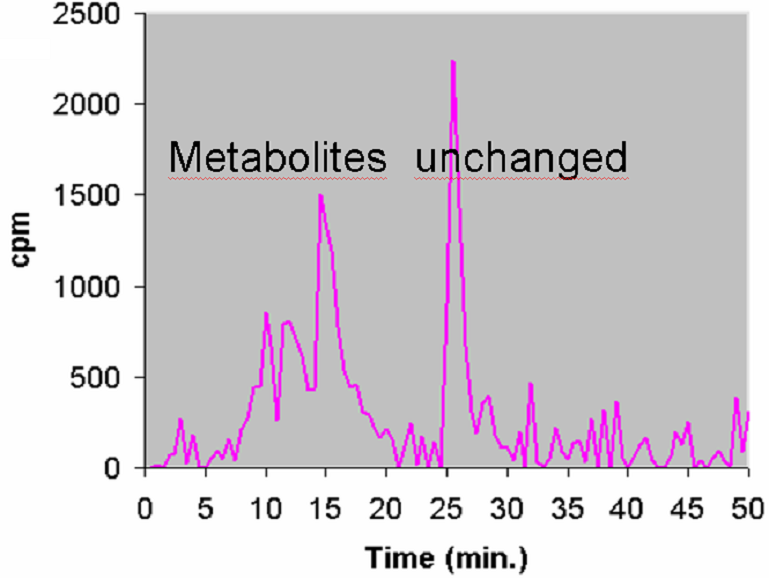
2.Further separation of tracer in plasma into tracer metabolites and unchanged tracer by filtration
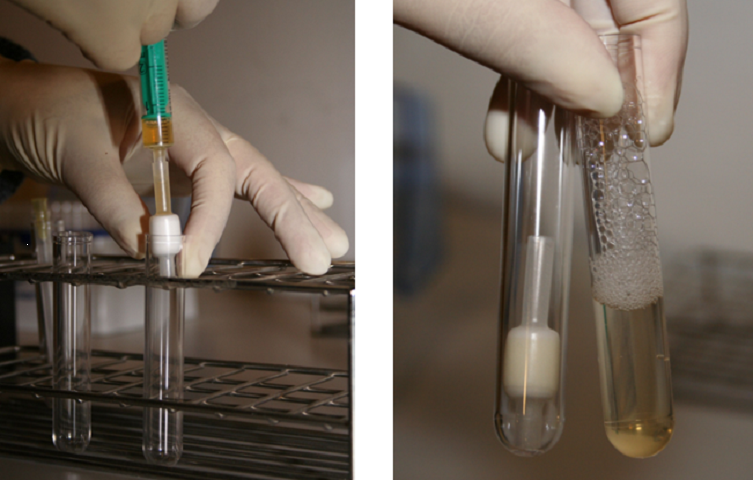
or HPLC (High Performance Liquid Chromatography).
3.Determination of the free fraction of unchanged tracer in plasma (fp), i.e. the fraction of tracer not bound to plasma proteins. Often fp is difficult to measure and thus not explicitly used. Hereby, fp = 1 is assumed, and the unchanged tracer concentration is regarded as the input function.
After the different tracer fractions in blood have been separated, it is necessary to calculate their activity concentrations. This is done by measuring them in a radioactivity counter and dividing the activity by the fractional volumes.
Fitting of Blood Curves by Models
Due to the experimental procedures involved the blood activity measurements are typically noisy and contribute a considerable amount of uncertainty to the analysis. Therefore it is often reasonable to fit analytical functions to the blood-related measurements, which is also applied for the interpolation between the samples, as well as for the extrapolation at late times when blood samples might be lacking.
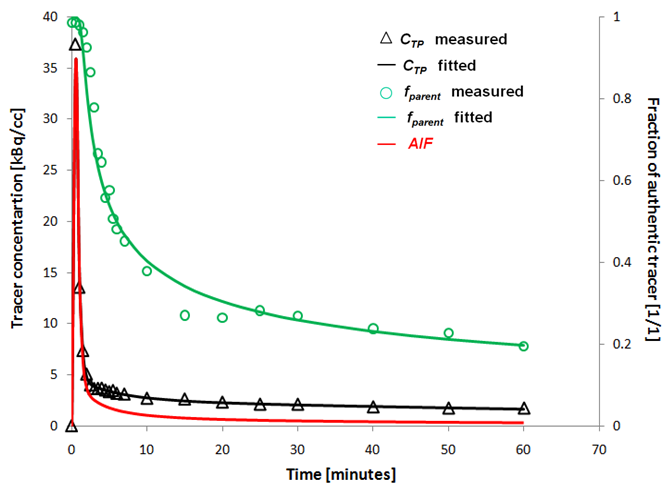
The example below illustrates the blood model approach.
•The black triangles represent the activity of tracer (free, bound to proteins, metabolites) in the arterial plasma during the study. A tri-exponential function which was fitted to these measurements and shown as the black line.
•The green circle represents the measurements of the fraction "Unchanged tracer in plasma" to "Total tracer in plasma". A model was fitted to these fraction values and shown as the green line.
•The arterial input function (AIF) is obtained by the multiplication of the two model functions and represented by the red curve, implicitly assuming fp = 1.
Note the sharp concentration changes at the early times after injection. To capture these changes adequately, rapid blood sampling is required during the first minutes after tracer injection.