The Edit Data button in the Tools list brings up a dialog window which allows the user to examine and manipulate the TAC data of the current data set.

The upper section lists the different curves. The blood-related curves are at the top, then come the regional tissue TACs. The arrows to the right can be used to change the TAC ordering, and a TAC can be removed by the x button.
The lower section lists the data of the selected curve. Shown for each sample are the acquisition start and end times, the measurement value (usually the VOI average), its standard deviation (the VOI stdv, if available), and the VOI volume. Note that the volume may vary if the VOI definition changes throughout the time course. The values of the tissue TACs can be interactively edited by clicking into a cell and changing the value.
The configuration button between the lists houses the following operations to modify TACs and generate new TACs, which will be appended to the list.
Average Weighted by Volume |
When several TAC curves are selected, this button allows calculating the volume-weighted average TAC. |
Average |
TAC averaging with equal weights. |
Add noise |
Creates a copy of the selected TACs and adds noise according to the definition defined in a dialog window. |
Basic operations |
Applies simple arithmetic operations to the values of the currently selected curves, and allows multiplying a curve by the values of an exponential function.
|
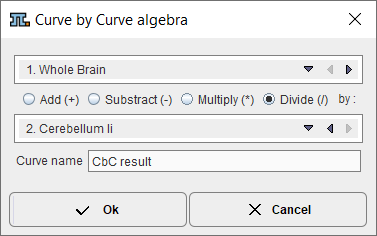
Curve by Curve operations |
Arithmetic operations between the values of two selected TACs.
|
Rename |
For renaming of the currently selected curve. |
Edit volume |
Change the volume of the selected TAC. |
Trim times |
Check for acquisition time overlaps of the selected TACs and correct. |
Correct decay |
Apply a decay correction to the selected TACs using the isotope half-life. |
Uncorrect decay |
Undo the effect of decay correction for the selected TACs using the isotope half-life. |
Edit curve |
Edit the data of the selected curve in a text editor as described below. |
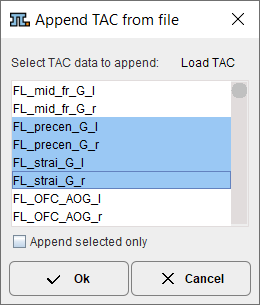
Append TAC from file |
Opens a facility for appending regional TACs stored in a file. After selecting the file with Load TAC, the regions are listed so that the user may select a subset. With Ok, the regional curves are appended to the existing ones. |
Dosimetry IDAC Export |
This entry is applicable only for the Cumulated Activity (OLINDA, IDAC) dosimetry model. It creates an input file to the IDAC dosimetry program. |
Dosimetry OLINDA/EXM Export |
This entry is applicable only for the Cumulated Activity (OLINDA, IDAC) dosimetry model. It creates an input file to the OLINDA/EXM dosimetry program. |
Dosimetry OLINDA 2 Export |
This entry is applicable only for the Cumulated Activity (OLINDA, IDAC) dosimetry model. It creates an input file to the OLINDA 2 dosimetry program. |

Edit Curve or Add New Curve
The Edit Curve tool brings up a dialog showing the data of the selected curve. The structure depends on the curve type selected, blood or tissue.
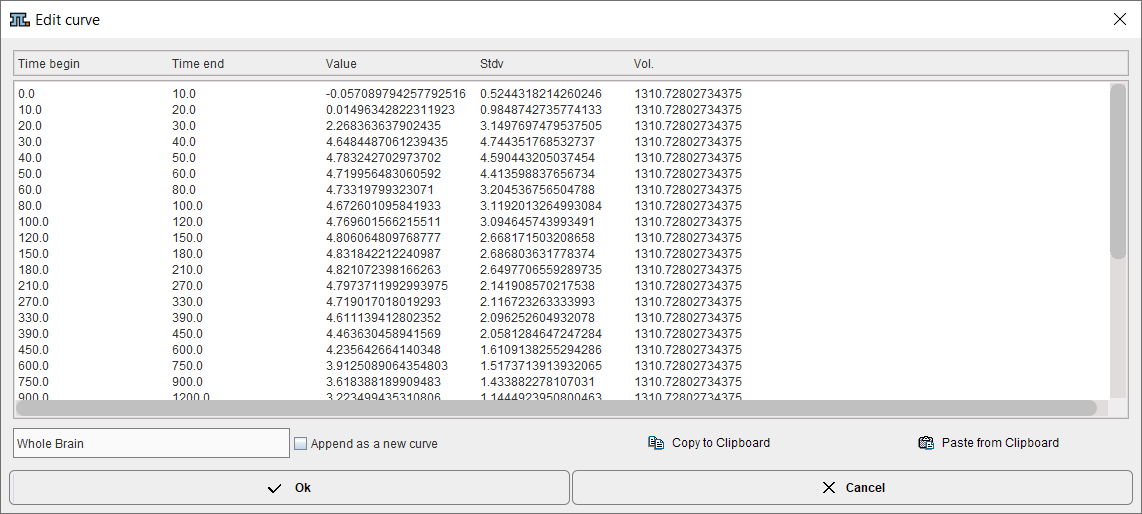
The data can directly be edited in this simple text editor, exported with Copy to Clipboard, edited e.g. in Excel, and brought back by Paste from Clipboard. Closing with Ok will replace the original curve data.If Append as new curve is checked, the user can change the curve name, and the curve will be appended to the region list.