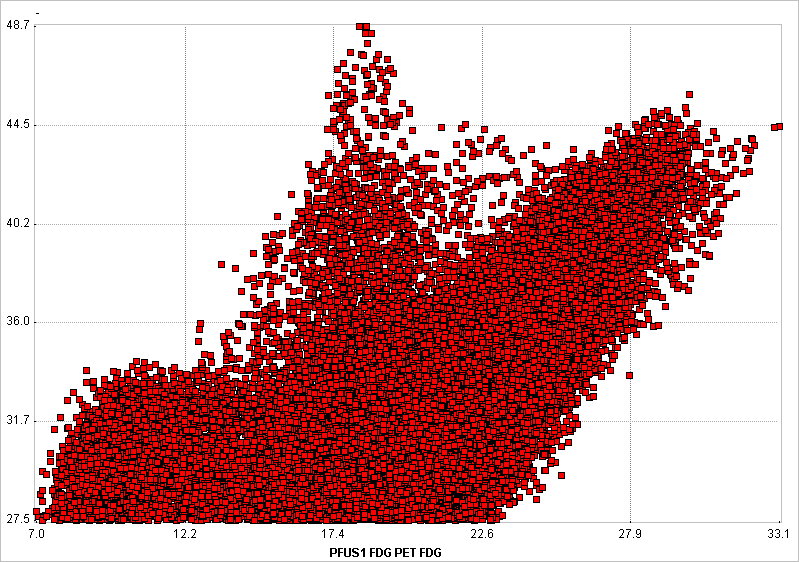
The shape of a scatter plot from a single VOI may contain diagnostic information. As an application example consider the case where the scatter plot of healthy controls is simple and symmetric
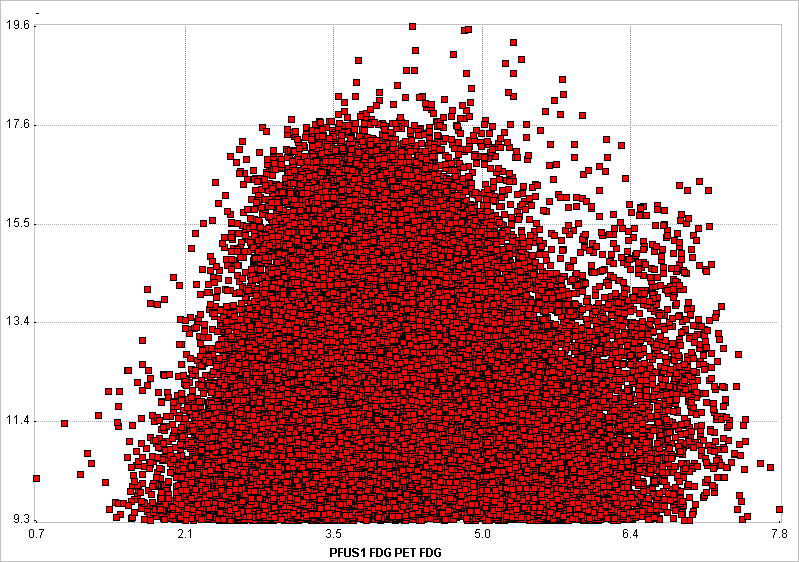
whereas subject scatter plots show distinct irregularities such as
In order to perform the shape analysis, the scatter plot is converted into a binary image in two steps.
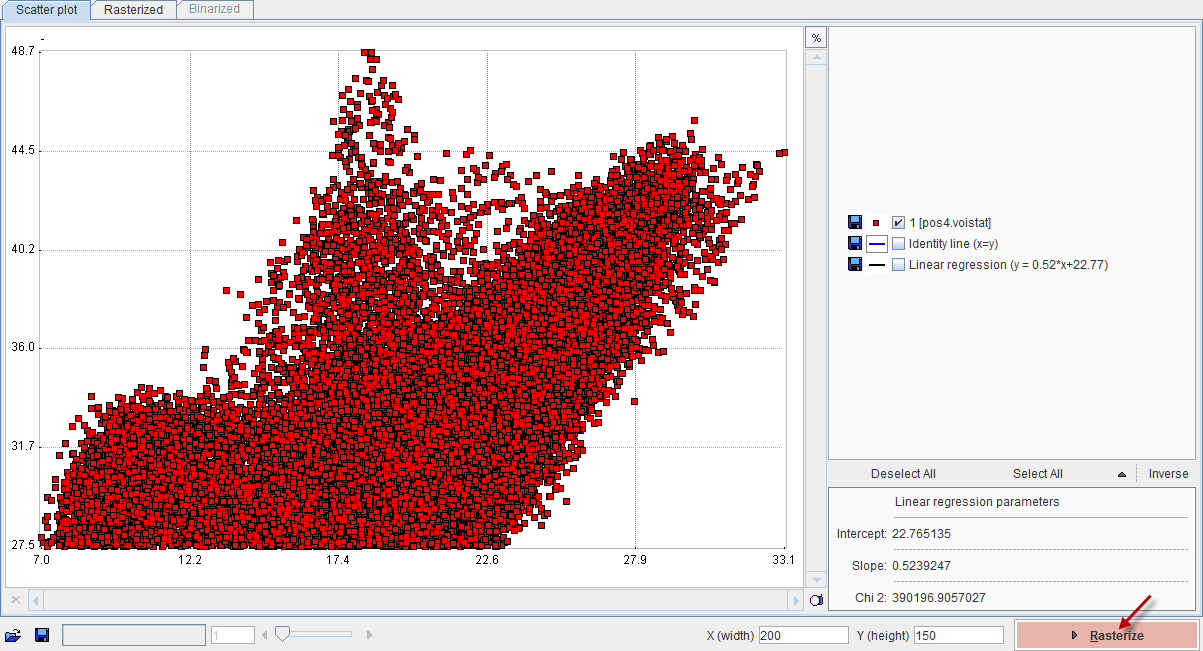
The Rasterize step creates an image from the scatter plot with dimensions X(width) and Y(height). The value of each pixel in the generated image corresponds to the number of scatter points included in the pixel area.
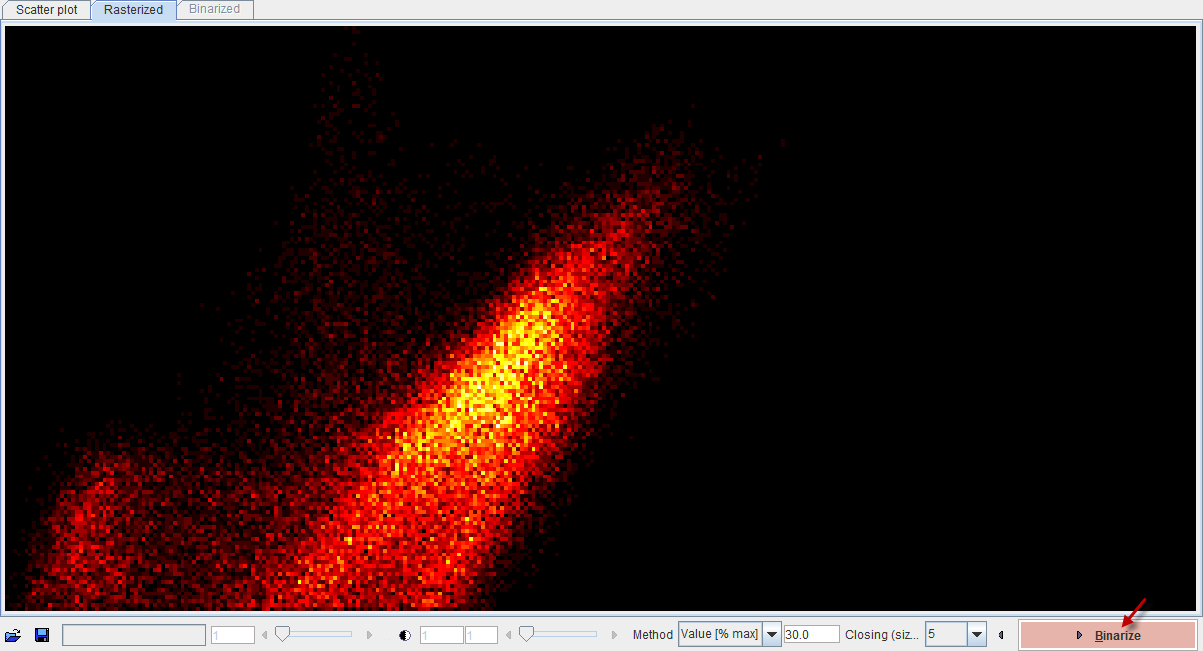
A threshold value is applied to this image in order to convert it into a binary image. The threshold can be set by choosing one of the Method selections: Optimal, Mean, Value [%max]. In order to fill small inner holes, a Closing morphologic operation can optionally be set with structure sizes of 5 and 7 pixels. After applying Binarize, the result is shown on the Binarized panel. Note that the result will depend on the image dimensions as well as the threshold setting.
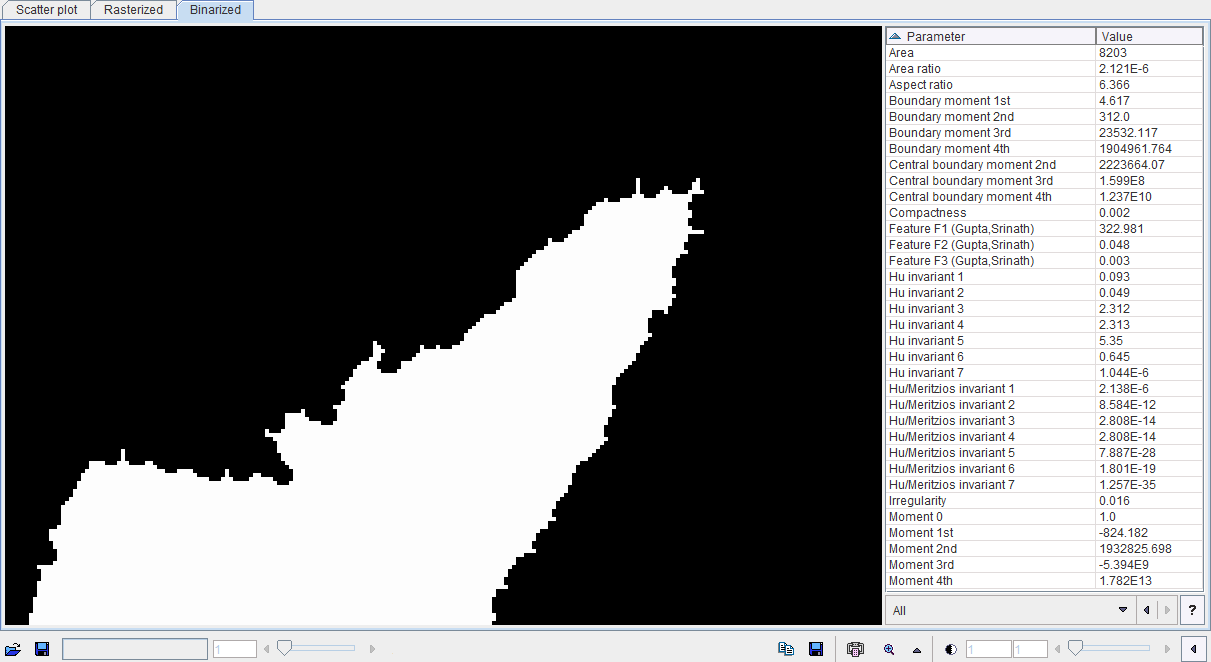
The binary structure who's shape is analyzed is shown to the left, and the resulting parameters in the list to the right. There are different metric types which can be selected from the list
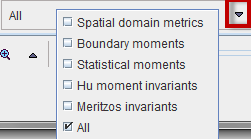
Please refer to Haidekker [1] for details about the metrics.
As usually in PMOD, these metrics can be saved to the clipboard, to a file, and aggregated for later statistics using the
![]()
buttons. By comparing the classification results between populations of controls and subjects, it may be possible to develop a criterion of disease.
Reference
1.Haidekker, M. A. (2010) Shape Analysis, in Advanced Biomedical Image Analysis, John Wiley & Sons, Inc., Hoboken, NJ, USA.