Sciagrà et al. have used the parametric MBF maps to study transmural abnormalities in patients with hypertrophic cardiomyopathy [1]. The analysis method has been implemented in PCARDP. It has the following configuration requirements:
1.Selection of NH3 as the tracer and activation of parametric mapping and transmural analysis.
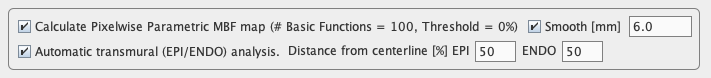
2.Selection of an EPI/ENDO active model segmentation type.
3.Selection of the Average on Model Crossing polar sampling method.
With these settings, the program performs parametric MBF mapping followed by a transmural analysis whenever kinetic modeling is started.
Sampling of Transmural Perfusion
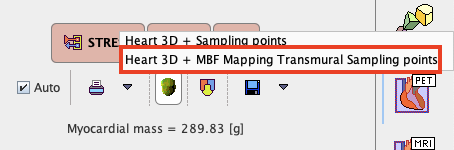
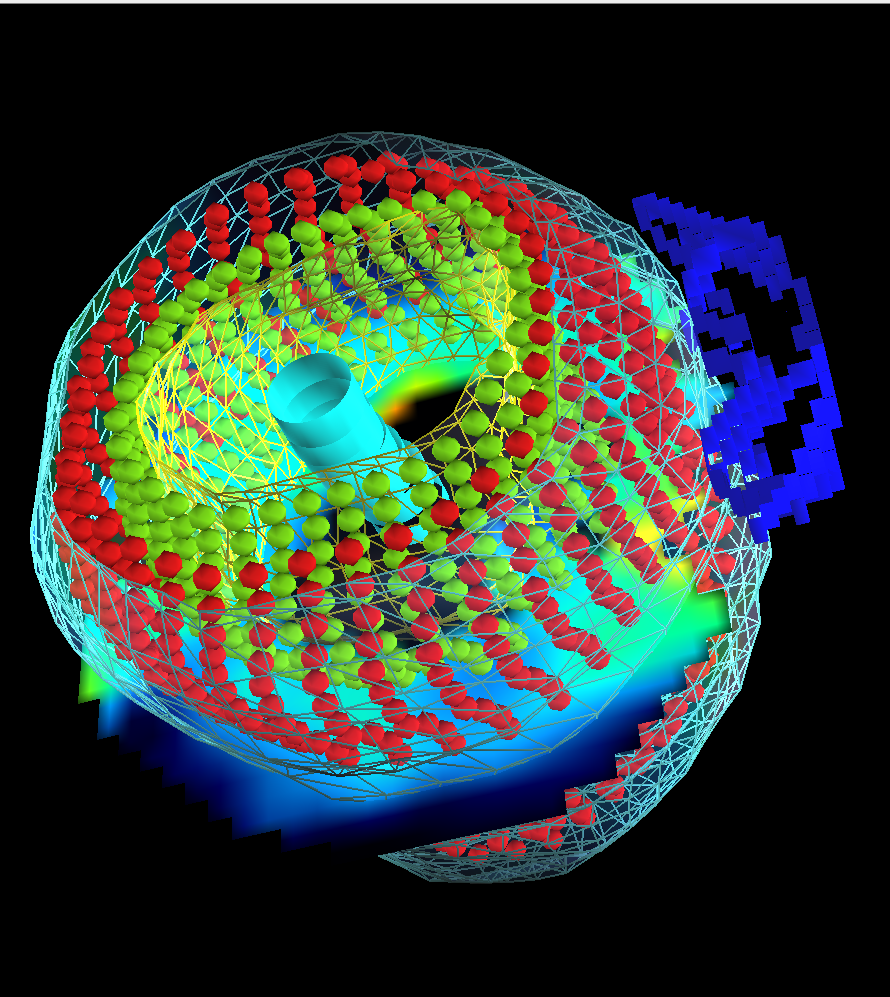
For each segment, two separate perfusion averages are calculated representing endocardial (ENDO) and epicardial tissue (EPI). The sampling points in the MBF map are offset from the centerline between the contours by percentages defined in the Distance from centerline configuration. 50% translates into the middle between the centerline and the boundary. The transmural sampling points can be inspected on the Kinetic Modeling page with the 3D rendering button
The capture below shows the results obtained with a 50% Distance from centerline.
Results
With transmural analysis enabled, additional results can be selected on the Compare page.
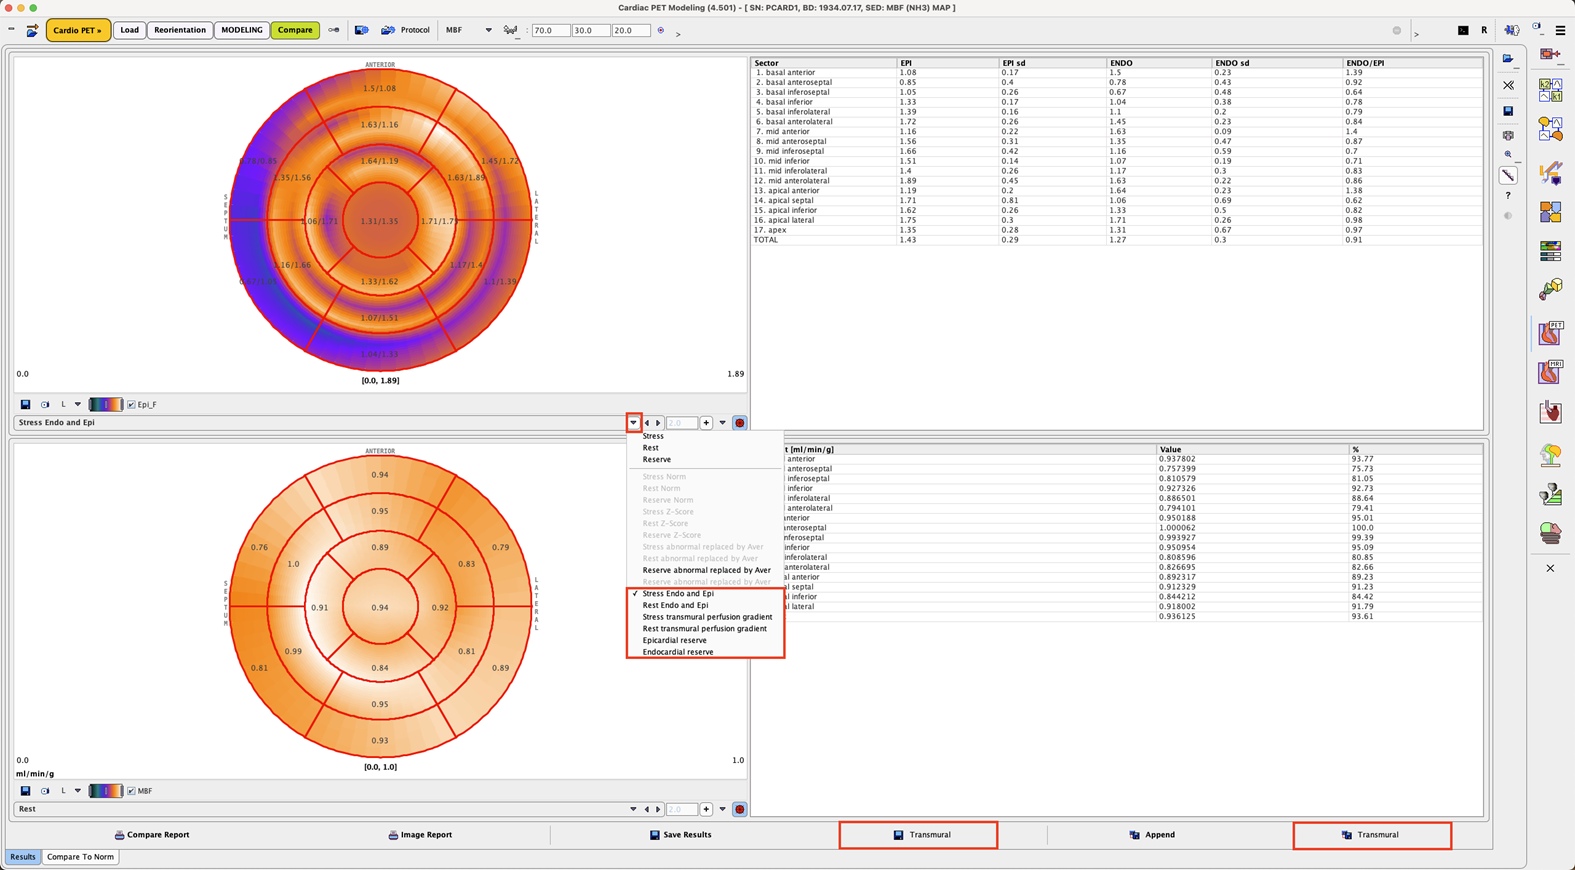
Stress Endo and Epi |
Stress results. For each segment and layer the average and standard deviation of the MBF values at the sampling points are listed, as well as the ENDO/EPI gradient. The polar plot shows both perfusion values per segment. |
Rest Endo and Epi |
Same results as above for Rest. |
Stress transmural perfusion gradient |
Similar as Stress Endo and Epi, except that the polar plot shows the gradient. |
Rest transmural perfusion gradient |
Similar as Rest Endo and Epi, except that the polar plot shows the gradient. |
Epicardial reserve |
Ratio Stress/Rest of the segmental perfusion in the epicardial layer. |
Endocardial reserve |
Ratio Stress/Rest of the segmental perfusion in the endocardial layer. |
The numerical results can be saved with the two Transmural save buttons.
Reference
1.Sciagrà R, Passeri A, Cipollini F, Castagnoli H, Olivotto I, Burger C, Cecchi F, Pupi A. Validation of pixel-wise parametric mapping of myocardial blood flow with 13NH3 PET in patients with hypertrophic cardiomyopathy. European Journal of Nuclear Medicine and Molecular Imaging. 2015;42(10):1581-1588.