The current stress and rest results are shown as the two polar plots in the first column, and below them the reserve polar plot. If a database is available and has been selected, the second column contains the normal stress, rest and reserve polar plots. The third column is prepared for the polar plots showing the deviation between the patient results and the normal database as z-score values.
The right side of the page contains two enlarged polar plots with their numeric values shown in a table next to them. Initially, they show the stress and rest information, but the user can switch them, for instance to show the perfusion reserve as illustrated below.

Using right-click into the plot area the controls can be shown.
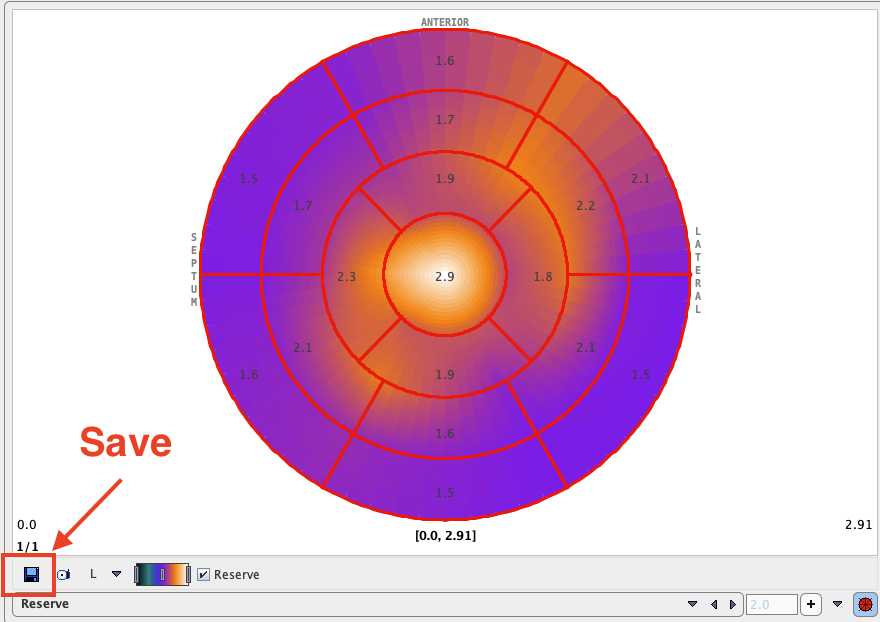
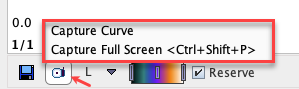
The saving icon indicated above allows saving the polar plot information for later inclusion into a cardiac normal database. The capture icon allows capturing the content of the selected panel (Capture Curve) or of the full screen (Capture Full Screen)
There are various options for the capture format as illustrated below:
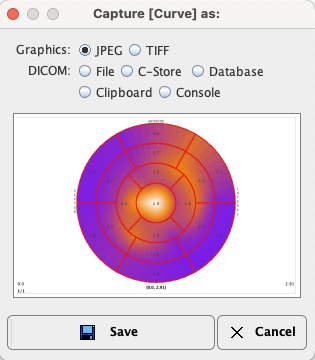
Using the DICOM File option the polar plots can be saved as DICOM Secondary Capture objects.
Rest/Stress Summary Report
The Reserve Report button compiles the Stress/Rest/Reserve information into a report summary page. The upper part contains a tabular summary of the absolute and relative flows (% of segmental maximum) as well as the myocardium flow reserve (MFR) in the different segments. The same information is then presented as polar plots, and finally as a bar plot to provide a intuitive overview of the situation.

As usual with PMOD reports it can be annotated, saved in different formats, and printed.
Saving and Inspecting Numeric Results
The numeric information of the table can also be saved or appended to a text file using the Save Results and the Append Results buttons, respectively. The saved file receives a .pcardRes suffix and can be visualized in Excel or a text editor (e.g Notepad).
Two different numeric results can be opened and compared within PCARDP module. This can be easily achieved activating the View Results ![]() option from the task bar to the right. Initially, a window appears allowing to select either a file from the database or a disk file. The
option from the task bar to the right. Initially, a window appears allowing to select either a file from the database or a disk file. The ![]() button opens a dialog window.
button opens a dialog window.

In the upper part the current path is indicated. The program automatically points to the directory of the last successful loading operation. It has elements for changing the directory: the navigation buttons in the Folder section (.. indicating one level up). All files suitable for loading (having the right suffix, *.pcardRes) in the search directory are listed in the Files section. The Open button starts loading the selected file, Cancel quits the operation, and Delete erases the file from the disk.
Finally, a comparison window displays in the left section the initial loading results:

In the right section of the panel the top Load button allows loading results obtained either from MRI or PET cardiac analysis for a side-by-side comparison. The Close button exits the comparison window.