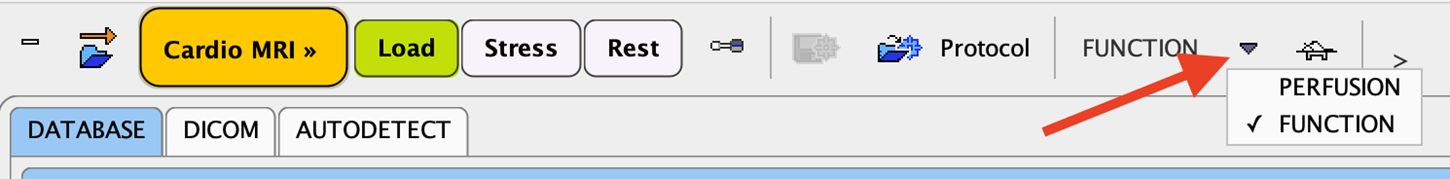
Start PCARDM with the
button in the PMOD ToolBox and switch the analysis type to PERFUSION with the button indicated below.
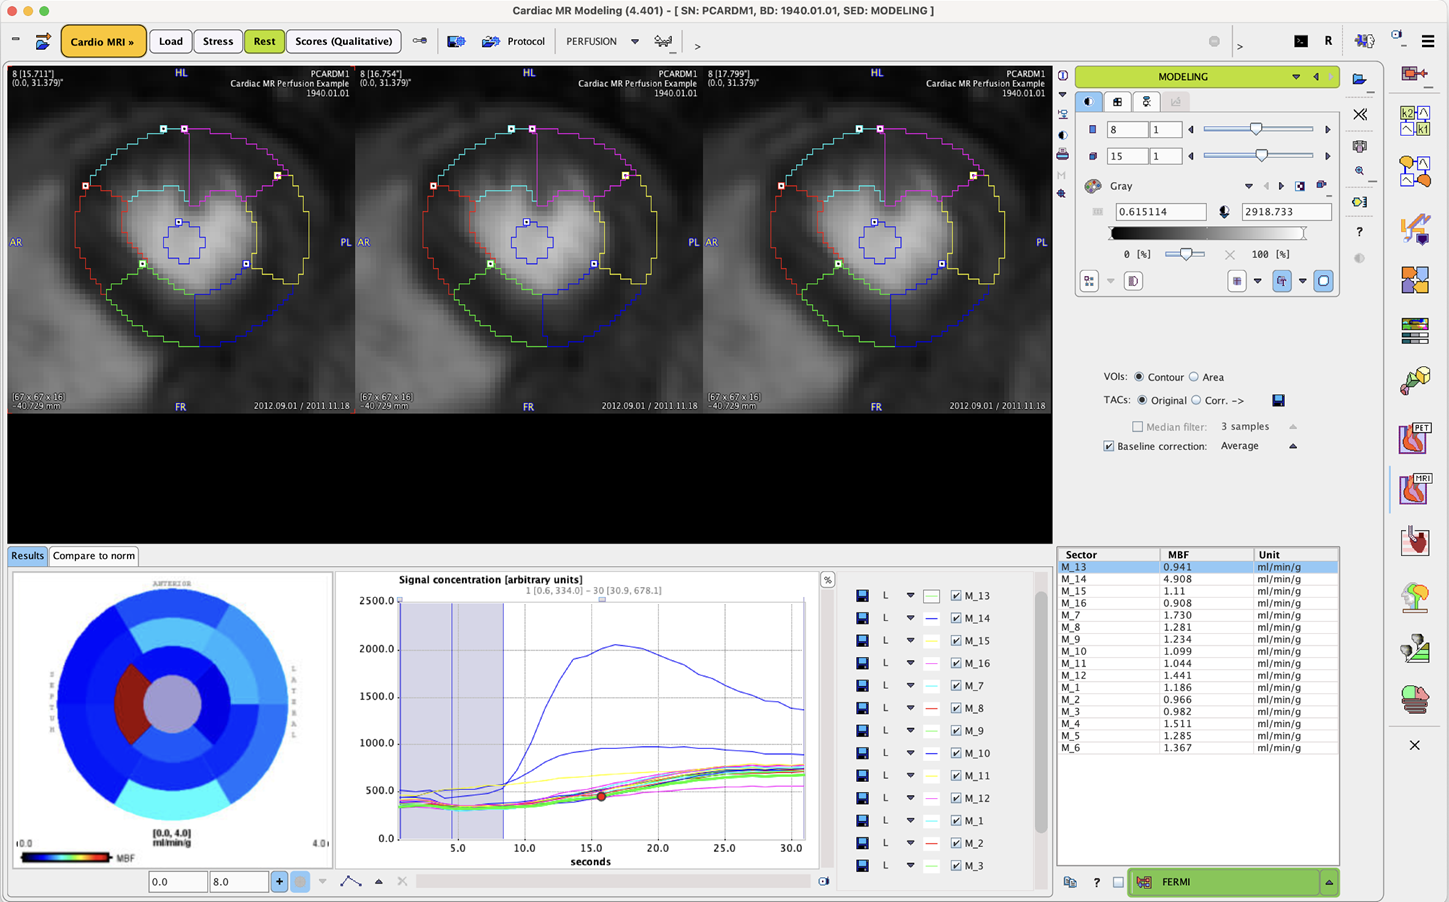
The user interface of PCARDM for the quantification of perfusion consists of four pages which can be selected by tabs:
1.Load page: This page is only available when the Use first page Database loader box is enabled the main PMOD configuration.
2.Stress page: Page for the step-wise analysis of the stress scan.
3.Rest page: Same page as for the stress scan, but for analyzing the rest scan. Definitions resulting from the stress analysis can be used as initial settings to be improved.
4.Scores (Qualitative) page: Page for interactively assigning visual scores to the heart sectors.
These pages are described in separate sections of this guide.
Step-Wise Processing
Flow quantification on the Stress and Rest pages is organized by a stepwise progression towards the end result. On each processing stage the user has to take some action such as data loading, heart sector definition, or kinetic modeling and then start the next processing step with the red action button located in the lower right. As soon as the result is calculated, it will be shown on the next page representing the new processing stage. The cascade of stages is available by the selection area in the upper right.
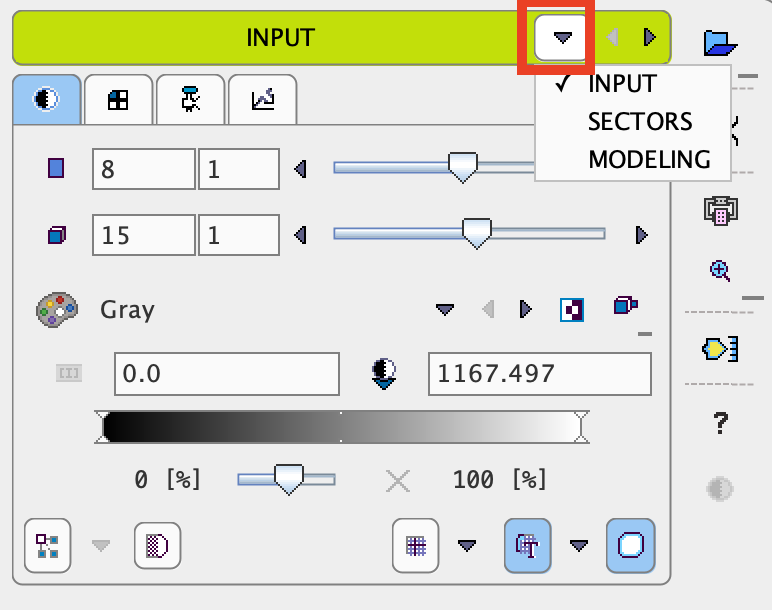
It conveniently allows inspecting the results of prior stages without initiating any calculations. To repeat a calculation with modified parameters, the action button in the lower right has to be activated again. The idea is to first fully process stress data, and then the rest data.
Convenience Buttons
Next to the action button is an area with two or three buttons
![]()
offering the following functions:
|
Hide the parameters panel to free some space in the user interface. With the panel hidden, the icon changes to |
|
Button to copy the definitions specified on the Stress page to the Rest page. The idea is that the analysis is first performed with the stress data, and then the stress definitions are adjusted to the rest images. |
|
Display help information for the current page. |