The current standard of CMR image analysis is the visual scoring of defects in cardiac segments. This task is also supported by PCARDM on the Scores (Qualitative) page.
Note: The Scores (Qualitative) page becomes only active after the cardiac segmentation has been performed and the TACs were calculated.
Scoring Systems
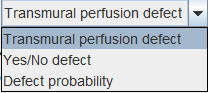
The task of qualitative scoring consists of manually assigning to each segment an index corresponding to a certain scoring system. In PCARDM three scoring systems are supported:
They include the following scores:
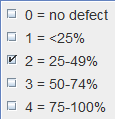
Transmural perfusion defect |
Percentage of transmural perfusion defect |
Yes/No defect |
Binary decision of defect in segment: |
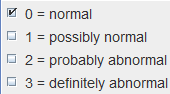
Defect probability |
Likelihood of defect presence: |
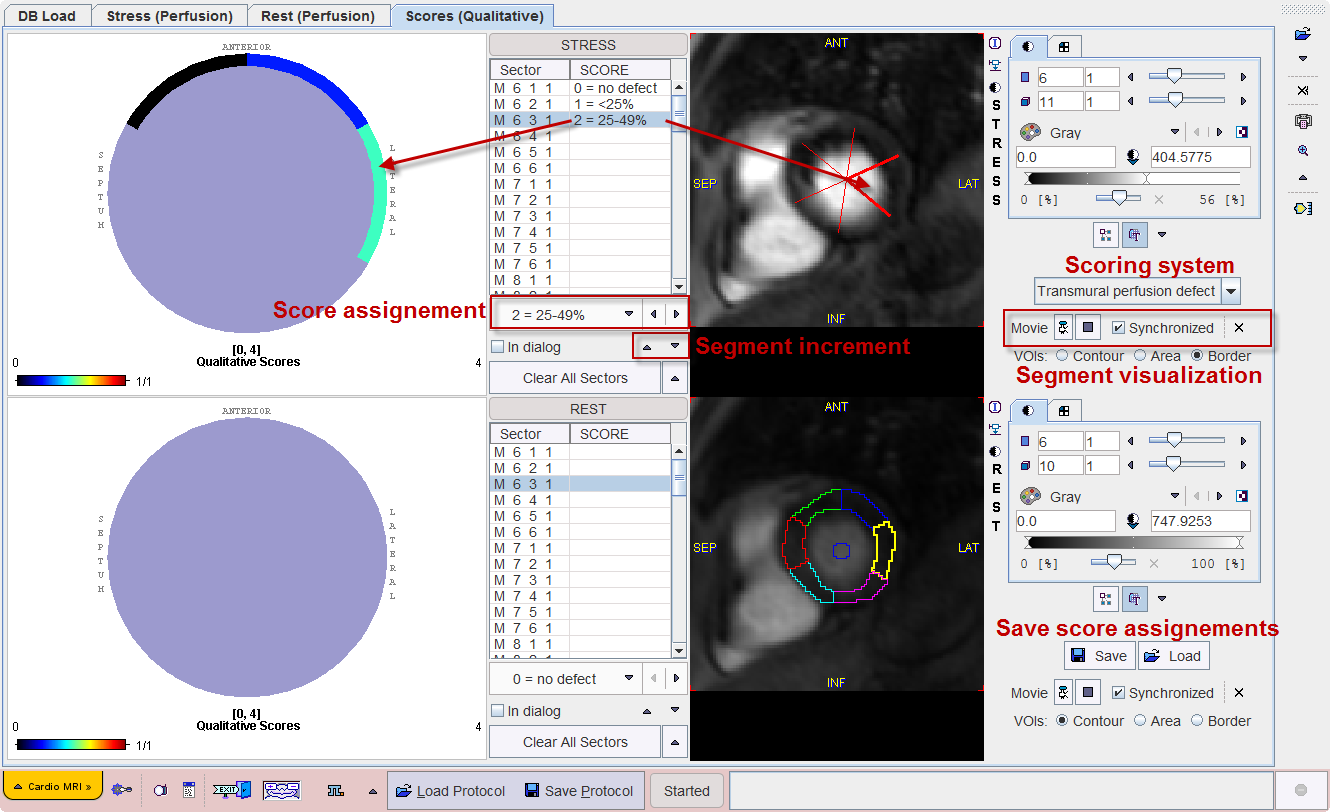
Score Assignment
Please proceed as follows for the assignment of scores to the segments:
1.Run the acquisition sequence as a movie to see the dynamics of contrast enhancement.
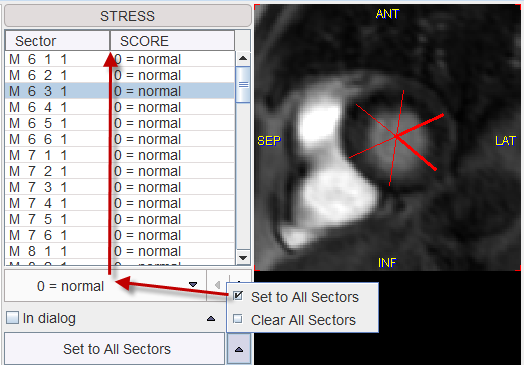
2.Select a segment in the STRESS or REST list.
3.The corresponding sector is highlighted as an overlay to the images. There are three ways of visualizing the sectors via the VOIs radio button setting: as outline contours (Contour), as filled areas (Area), or as a star-like set of lines dividing the myocardium (Border). The selected sector appears emphasized.
4.Observe whether the dynamics of contrast enhancement in the sector indicates a perfusion defect.
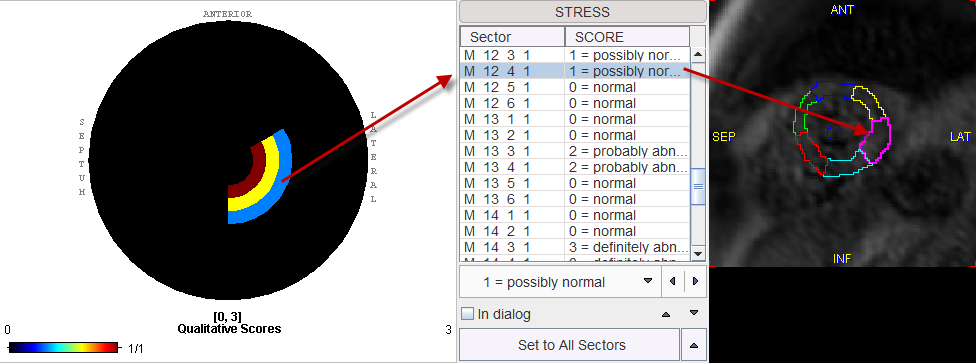
5.Select the corresponding score value from the score list. The area in the polar plot corresponding to the segment is colored accordingly.
6.Repeat the process for the next segment which can directly be selected in the list, or by incrementing the segment selection with the down arrow.
If only a few segments are defect, the easiest approach is to first set the normal score to all segments as illustrated below, and then selectively score the defect segments.
Polar Score Plot
Given proper order of the loaded images, the polar plot is arranged such that the apical segments are located in the center and the basal segments along the outer border. The polar plot, the list and the images with the sectors are synchronized. When clicking into the polar plot the corresponding entry in the list and the corresponding segment in the image are highlighted. Similarly, the list entry or the image segment can be selected.
After all assignments of the stress and rest scan have been completed, it is recommended to save the score configuration. The saving format is intended for restoring the assignments in the user interface. Please use the results table for exporting the numeric scores for an external statistical analysis.