When interactive modeling is enabled, a dialog window of PMOD's PKIN modeling tool appears with the prepared contrast concentration curves loaded.
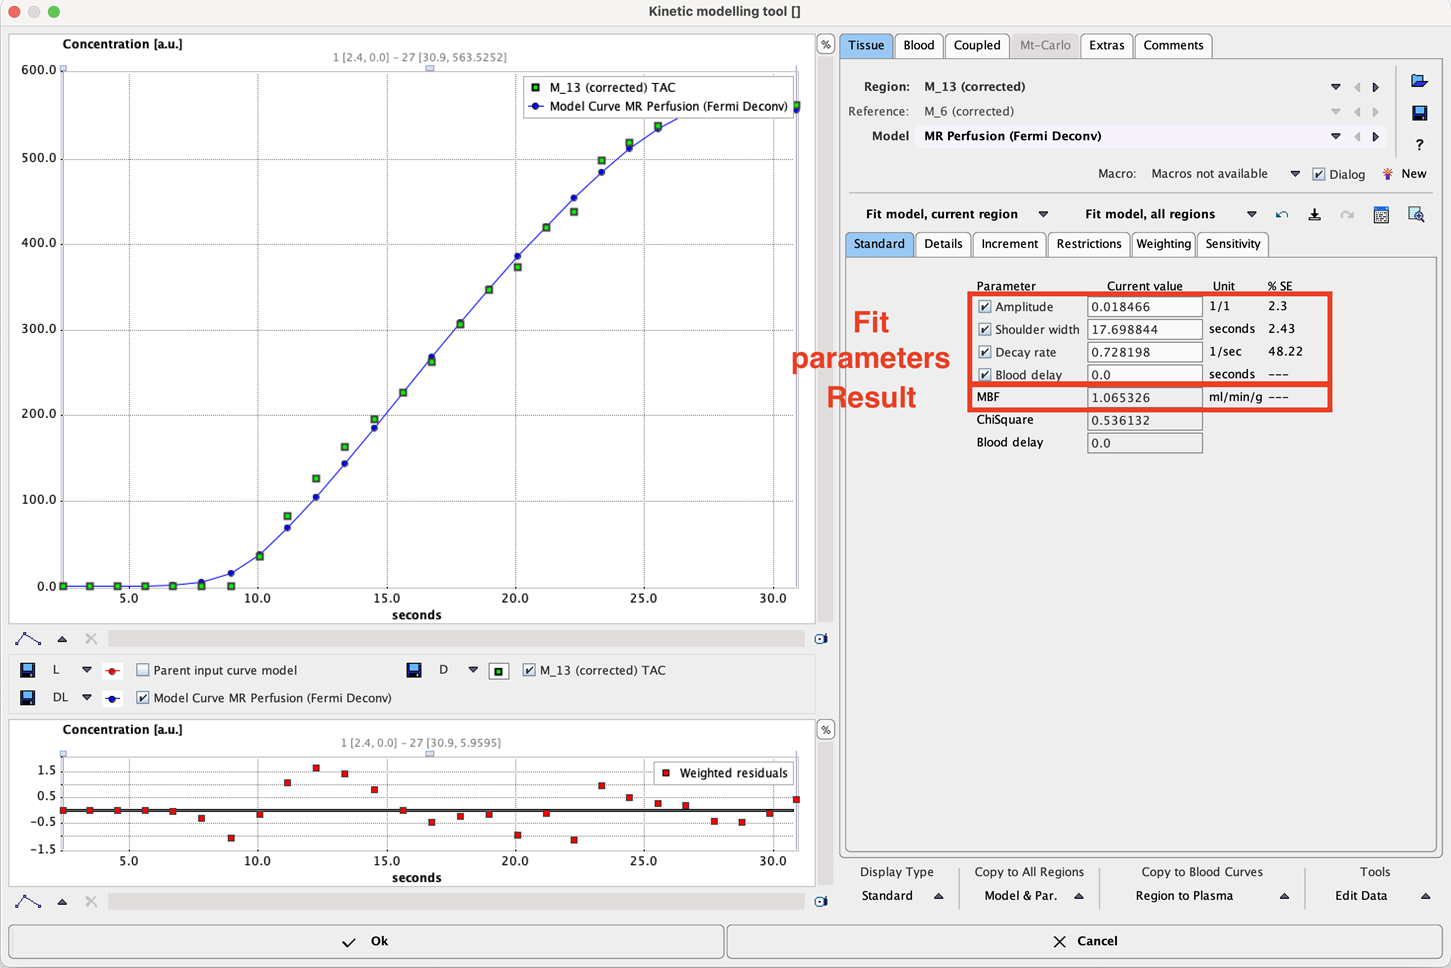
The upper left curve window shows the signal curve as green squares and the current model curve as connected blue dots. The LV curve is initially hidden. It can be shown by enabling the Plasma input curve model box.
The Model selection is set according to the action button for starting the tool, but can be switched if needed. The MR Perfusion (Fermi Deconv) model has four parameters for fitting the shape of the signal, and the result parameter Flow which is derived from them.
Please use the Fit all regions button to adjust the model to each segmental curve. There might be a message indicating that for some TACs the fit failed.
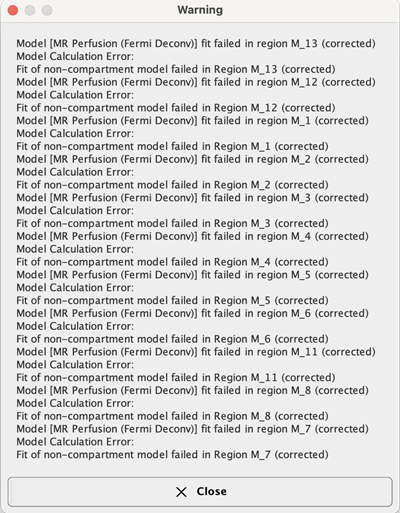
The first thing to try is to activate Fit all regions again. This time fitting will start from changed initial parameter values and there is a chance that the indicated problem disappears.
Trouble-Shooting
Switch to the problematic TAC by selecting the corresponding entry in the Region list, in the example below M_13.
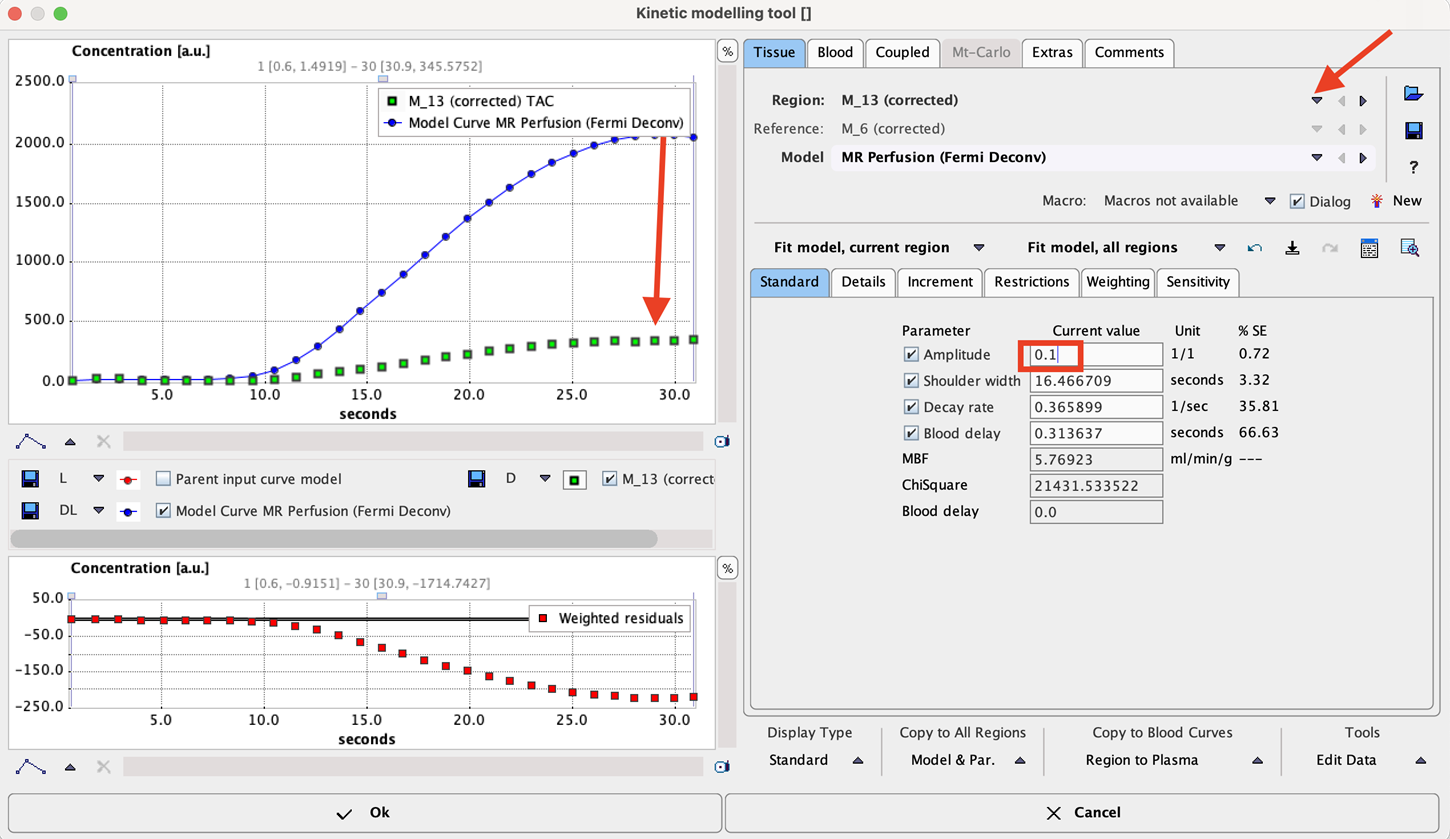
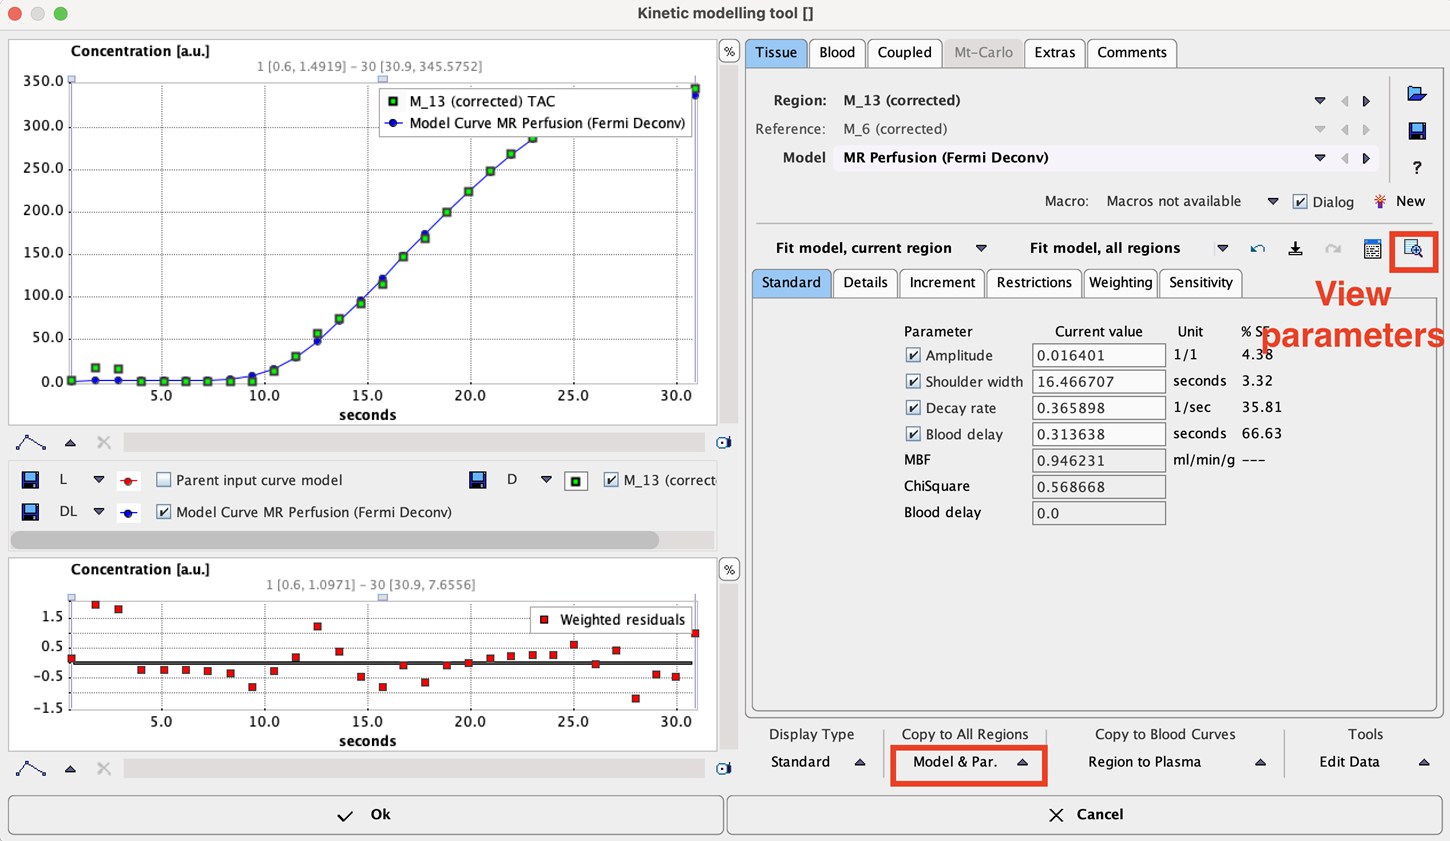
It is apparent that the model is too high. So reduce the Amplitude parameter to a smaller value, e.g. 0.05. Then try fitting with the Fit current region button. If it works, the problem is solved. This is the case in the example where a Flow value of 0.874 ml/min/g resulted.
If the fit worked, the next problematic TAC can be addressed in a similar manner. If not, try to change the parameters such that the model shape comes even more close to the measurement, and try again.
Another alternative is to switch the Region to a neighboring TAC which was successfully fitted. Then propagate the successful model parameters as initial parameters to all TACs with the Model & Par button in the Copy to All Regions area. Finally activate Fit all regions again. This approach may fix all problems at once.
Parameters Summary
A convenient summary of the resulting parameters can be obtained with the View Par button in the Tools are. It shows a dialog window with all parameters for all segments, as illustrated below.
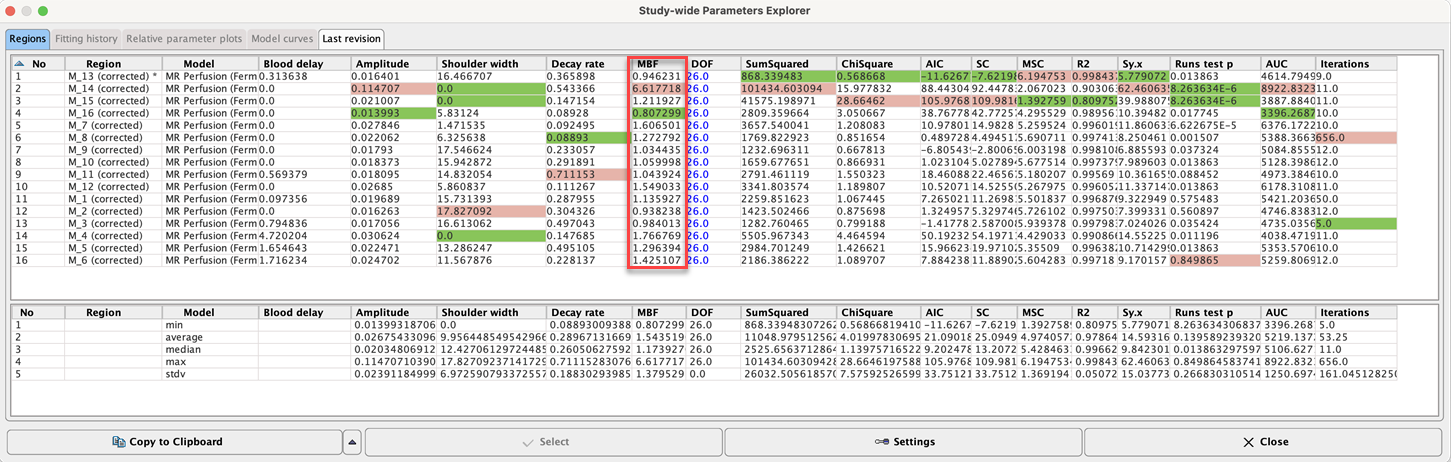
The minimal and maximal values per row are easy to find because they are highlighted in green and red. Please refer to the Kinetic Modeling Tool (PKIN) Guide to learn more about the features of the quantification module.
Returning the Quantification Results
Once the model has successfully been fitted for all TACs, use the Ok button to close the quantification module and return the flow values to the PCARDM tool.