The MRI Signal to Concentration tool was developed for converting the signal of dynamic MR sequences into concentration measurements of the contrast agent used. Three different acquisition sequences are supported
Dynamic Contrast-Enhanced MR (DCE)
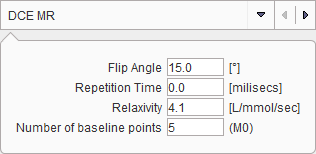
The DCE method requires that in addition to the DCE data a matched T1 map has been loaded. It is recognized by being a static series, whereas the DCE is dynamic. Note that there is the MRI T1 Map tool which supports the calculation of T1 images from a sequence of gradient echo images acquired with variable flip angles q (FLASH sequence).
The equilibration magnetization M0 is also required for the calculation. It is determined from the baseline average of the DCE signal before contrast arrival by
![]()
where S is the steady state signal, and T10 the pre-contrast longitudinal relaxation time. Using M0 and T10 the relaxation rate R1(t) during the DCE scan can be calculated by [1]
![]()
where S(t) is the DCE signal, and S(0) the baseline signal before the Gd contrast agent arrives in the tissue. Finally, using R1(t) and the relaxivity r1 of the contrast agent used, the concentration of the contrast agent can finally be calculated by [1]
![]()
where r1 is in [L/mmol/sec] units. Carbonaro et al. [2] provide the following relaxivity values for 1.5T:
Brand Name |
Acronym |
R1-relaxivity [L/mmol/sec] |
Magnevist |
Gd-DTPA |
4.1 |
Dotarem |
Gd-DOTA |
3.6 |
ProHance |
Gd-HP-DO3A |
4.1 |
Omniscan |
Gd-DTPA-BMA |
4.3 |
Gadovist |
Gd-BTO3A |
5.2 |
OptiMARK |
Gd-DTPA-BMEA |
4.7 |
MultiHance |
Gd-BOPTA |
6.7 |
K-t SENSE Sequence
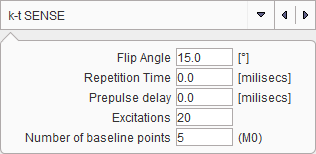
The k-t SENSE method [3] requires that in addition to the dynamic data a matched T1 map has been loaded. The relaxivity R1 is first calculated from the model function of the signal by an iterative fit.
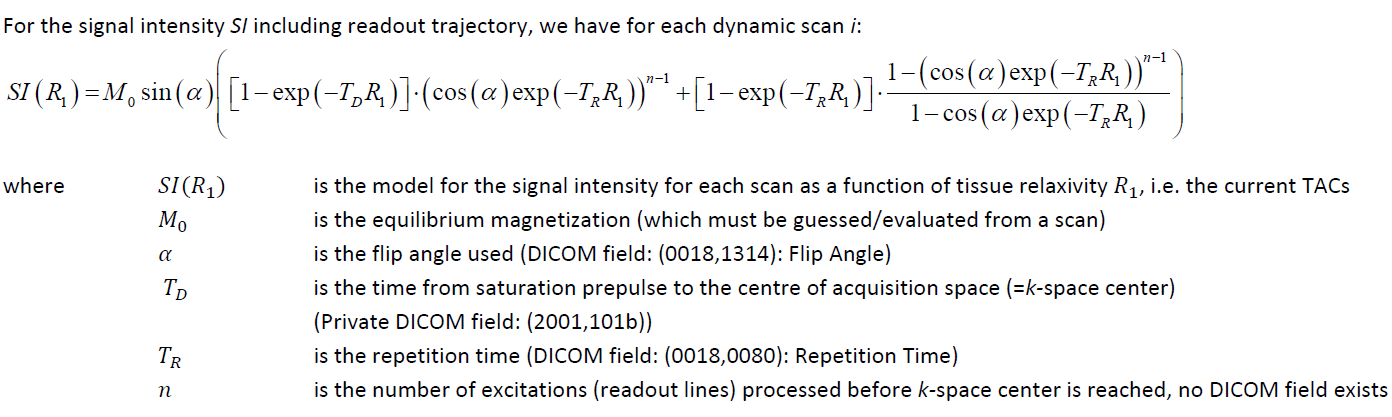
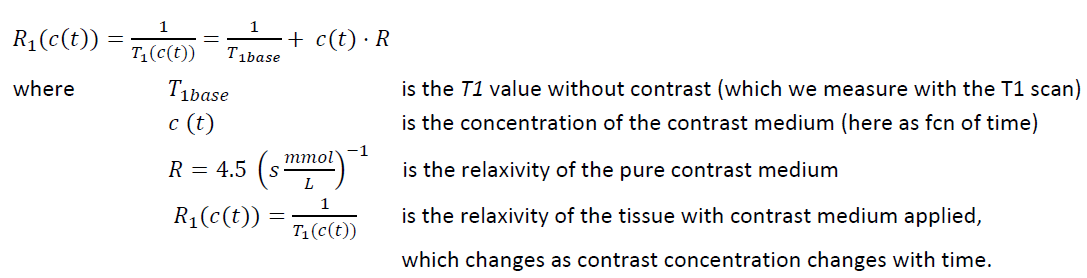
The R1 obtained is then used in the equation below, which is solved for the contrast concentration C(t).
Dynamic Susceptibility Contrast MR (DSC)
This tool calculates the contrast concentration for data acquired with the FLASH sequence [4].
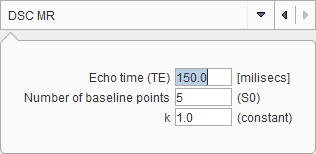
A linear relationship is assumed between the tissue contrast-agent concentration C and the change in T2* relaxation rate, ΔR2*. The concentration of the contrast agent is given by
![]()
S0 is the precontrast baseline signal, S(t) the postcontrast signal, and TE the echo time, and k a proportionality constant.
References
1.D.L. Buckley, and G.J.M. Parker. Measuring contrast agent concentration in T1-weighted dynamic contrast-enhanced MRI. in: A. Jackson, D.L. Buckley, and G.J.M. Parker, (Eds.), Dynamic Contrast-Enhanced Magnetic Resonance Imaging in Oncology, Springer, Berlin, pp. 69-79, 2005.
2.Carbonaro LA, Pediconi F, Verardi N, Trimboli RM, Calabrese M, Sardanelli F. Breast MRI using a high-relaxivity contrast agent: an overview. AJR Am J Roentgenol. 2011;196(4):942-55.
3.Wissmann L, Niemann M, Gotschy A, Manka R, Kozerke S: Quantitative three-dimensional myocardial perfusion cardiovascular magnetic resonance with accurate two-dimensional arterial input function assessment. Journal of cardiovascular magnetic resonance : official journal of the Society for Cardiovascular Magnetic Resonance 2015, 17:108.
4.Wirestam R, Andersson L, Ostergaard L, Bolling M, Aunola JP, Lindgren A, Geijer B, Holtas S, Stahlberg F: Assessment of regional cerebral blood flow by dynamic susceptibility contrast MRI using different deconvolution techniques. Magnetic resonance in medicine 2000, 43(5):691-700. HTML