The closed-form solutions of compartment models involve the convolution of the input function with decaying exponentials. Based on this observation, a generalized technique called spectral analysis (SA) was introduced by Cunningham and Jones [66]. The operational equation of SA is given by
that is, tissue uptake is modeled as a sum of N possible tissue responses. Due to the constraint of first order tracer kinetics, the coefficients ai and the decay constants bi must be non-negative. In practice, a discrete set of the decay constants βi is selected which covers the physiologically reasonable range, typically logarithmically spaced in the range [10-5,1]sec-1. The corresponding tissue responses
![]()
are the basis functions of spectral analysis.
When fitting the operational equation above to a tissue TAC, the only unknowns are the coefficients ai, because only a pre-defined set of discrete βi values is considered. Therefore, the problem is that of a non-negative linear least squares estimation (NNLS) with the constraint of non-negative coefficients. There is a well-known NNLS algorithm available [67], which allows readily calculating the optimal set of ai coefficients. They allow calculating the model function and visualizing it together with the tissue TAC in the same way as for the compartment models.
An advantage of SA is the fact that no particular compartment structure is imposed. Rather, its result can be used to estimate how many kinetic tissue compartments can be resolved by PET. To this end, the results are plotted as a spectrum with the selected decay constants βi along the x-axis (as the "frequencies") and the estimated coefficients ai along the y-axis (as the "amplitudes"). Because of the large range, log(βi) is used in spectrum plotting rather than βi. The number of peaks in this spectrum corresponds to the number of distinct compartments. A peak appearing to the far left (low frequency, slow component) indicates irreversible trapping. A peak to the far right (high frequency, fast component) corresponds to kinetics indistinguishable from the input curve, thus to vascular contributions. Intermediate peaks represent compartments which exchange reversibly with plasma or with other tissue compartments [68].
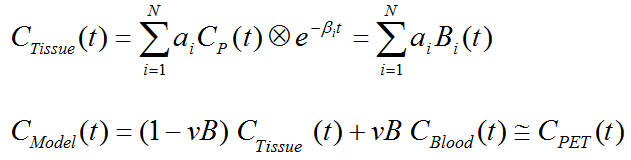
The examples below used synthetic data generated using compartment models without noise and blood contributions. In the first example the simulated tissue TAC of a 1-tissue compartment model was fitted by SA with 500 basis functions. It is evident that, because of the discrete nature of the βi basis, the compartment was split into two neighboring frequencies. The adjacent amplitudes are usually summed to provide the combined peak height for a compartment.
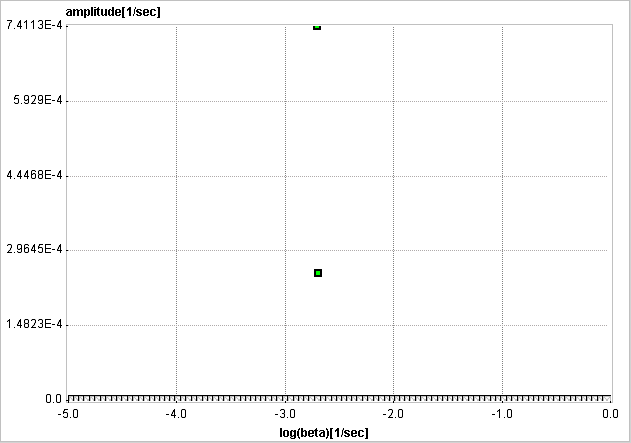
In the next example an irreversibly trapping compartment was added (k3>0, k4=0) to the same first compartment. The corresponding peak is clearly seen to the left of the spectrum.
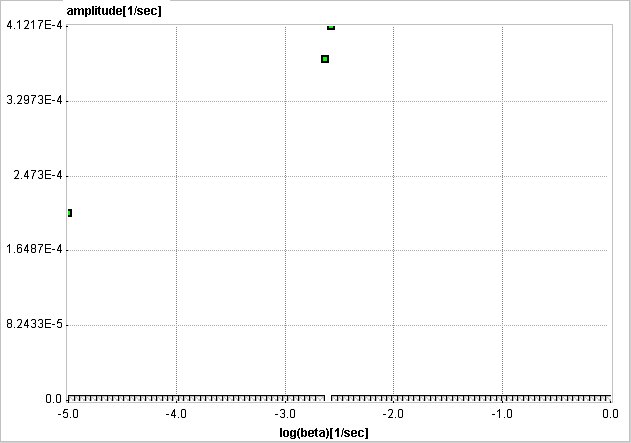
When changing kinetics to become reversible (k4>0), the second compartment appears as a second peak in the inner of the spectrum.
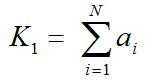
In general it is not possible to calculate the compartment rate constants from the spectral analysis outcome. However, an estimate of K1 can be obtained as the sum of the peak amplitudes
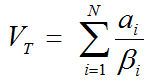
and an estimate of the distribution volume VT as
An additional information which can be calculated is the impulse response function
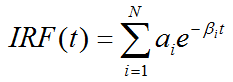
The impulse response function completely describes the system, and the expected tissue TAC for any given input function and can simply be calculated by convolution with the IRF:
![]()
In the practical application of spectral analysis potential problems were found: Caution should be applied when interpreting the number of peaks [66], and the error properties of the estimates are difficult to assess [69]. Several authors have proposed variants to overcome these problems [70,71], but in current practice spectral analysis is not yet frequently applied.