The MLAIR method has been developed by Kim et al. [1] for tracers undergoing irreversible trapping. It is an alternative to the Patlak plot analysis which is dependent on the specification of an equilibration time t* which may vary among tissues, and may suffer from bias when applied to noisy data. It has applied for the analysis of FDG, which can be modeled as a 2-tissue compartment model with k4=0, and 11C-labeled MeNTI [1].
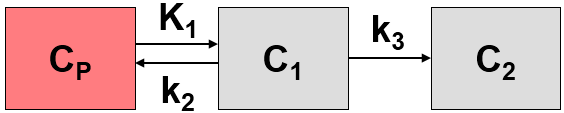
Operational Model Curve
The authors develop two approaches, both of which are included in the Irreversible Ki (MLAIR) model. The 2-tissue compartment model structure with k4=0 is assumed. A blood volume fraction vB is taken into account, but applied to the metabolite-corrected input curve Cp(t) rather than the whole-blood activity.
The operational equation of method MLAIR1 for the the measured tissue TAC CT(t) is given by
![]()
The linear coefficients are related to the model parameters as follows, allowing to calculate the influx Ki from P3 and P4.
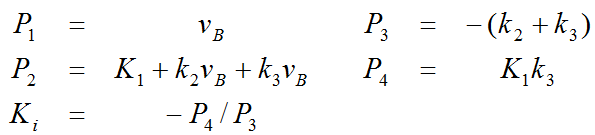
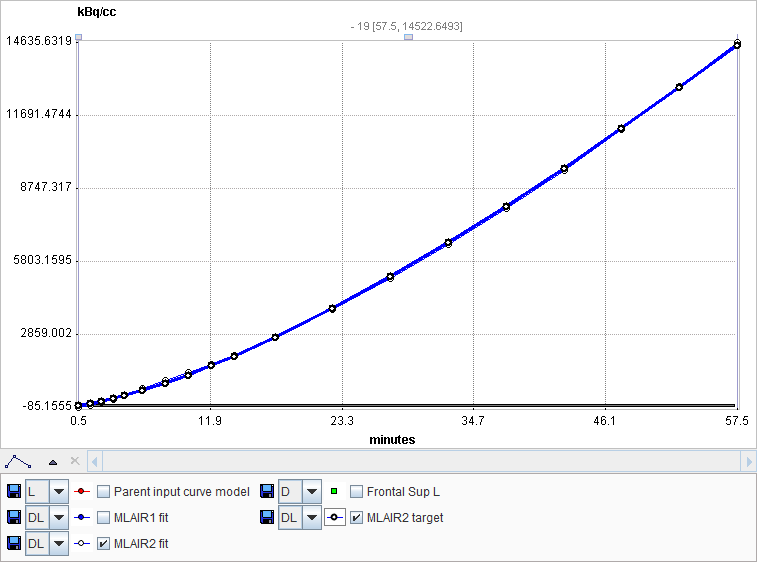
In order to avoid the P4/P3 division of MLAIR1 which might intorduce artefacts for noisy data, a second second multilinear operational equation MLAIR2 was developed which estimates Ki as a direct regression parameter. MLAIR2 has the following operational equation for the integrated tissue activity curve:
![]()
![]()
MLAIR2 is more robust and preferred for pixelwise noisy TACs, whereas MLAIR1 is less biased and preferred for VOI based TACs. SVD-based multi-linear regression is applied for model fitting.
Acquisition and Data Requirements
Image Data |
A dynamic PET data set of a tracer with irreversible uptake. |
Blood Data |
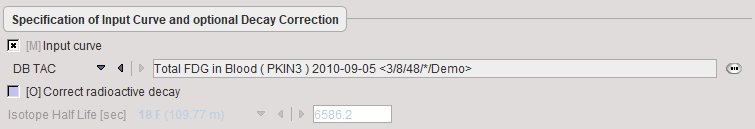
Input curve from the time of injection until the end of the acquisition. |
Tissue TAC |
A regional time-activity curve from a representative brain region. It is presented as a Logan plot and can be used to define the linear segment where regression analysis should be done. |
Blood Preprocessing
Decay correction is the only blood correction option.
Model Preprocessing
The preprocessing perfoms an MLAIR analysis of the TAC1 specified. It uses the MLAIR model implementation in PKIN.
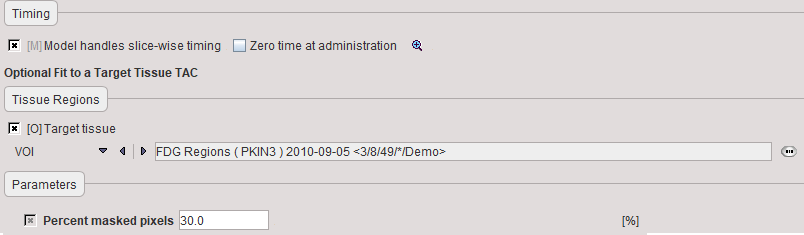
There are no parameters to configure except for the background thresholding.
Percent masked pixels |
Exclude the specified percentage of pixels based on histogram analysis of integrated signal energy. Not applied in the presence of a defined mask. |
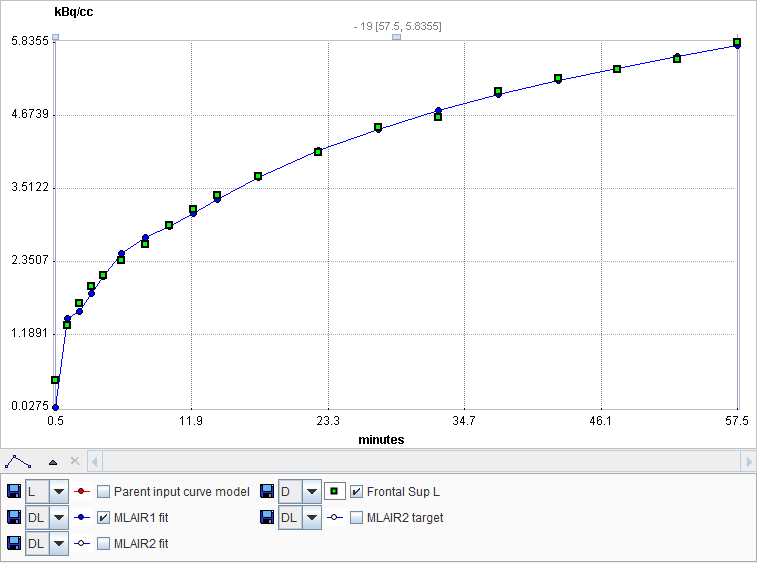
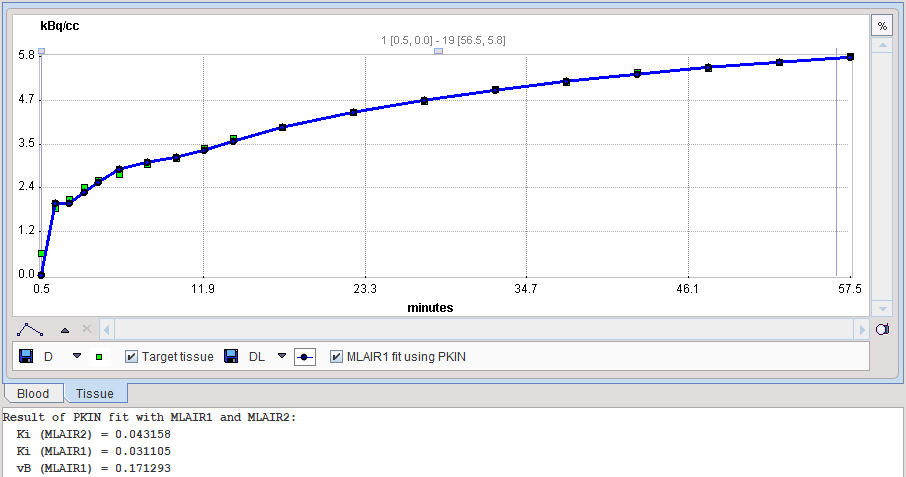
The MLAIR1 fit is shown in the preprocessing Result. In order to see the result of MLAIR2 please transfer the data to PKIN and apply the model there.
Model Configuration
![]()
Ki (MLAIR2) |
Influx rate estimated with the more robust variant MLAIR2, which may suffer from more bias. |
Ki (MLAIR1) |
Influx rate estimated with the less robust variant MLAIR1. |
vB |
Estimate the blood volume fraction by MLAIR1. |
Reference:
1.Kim SJ, Lee JS, Kim YK, Frost J, Wand G, McCaul ME, Lee DS: Multiple linear analysis methods for the quantification of irreversibly binding radiotracers. J Cereb Blood Flow Metab 2008, 28(12):1965-1977. DOI