When a compartment system has equilibrated, the total distribution volume can be calculated easily as the ratio of tracer concentration in tissue to the metabolite-corrected plasma concentration with a single static scan. It has been found that the time required to reach equilibrium can be shortened by an optimized tracer delivery. A setup which does not require a sophisticated tracer delivery system is to apply an initial bolus and continue with a constant infusion.
Carson et al. [1] have developed a method to optimize the ratio between the activity given as the initial bolus and the activity level of the subsequent infusion for quickly reaching an equilibrium (Appendix B in [1]). It is assumed that tissue TACs as well as the input curve have been measured beforehand in a bolus experiment. Ideally then, the measured activities represent the impulse response of the system. Under this assumption it is possible to calculate the tissue response for any given input curve by just convolving the TACs with the input curve.
Operational Model Curve
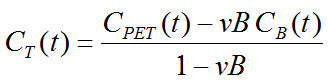
For a bolus and infusion (B/I) experiment the input function can be described as an initial impulse followed by a step function, and the convolution can be analytically solved. The resulting model curve

is a function of the bolus fraction and the infusion duration. Kbol [min] defines the dose of the bolus expressed as minutes of infusion, and T is the total duration of the infusion (end of last frame).
Note that an explicit blood volume correction is available via the vB input parameter. In the case of vB=0 (default setting), no correction is performed. For vB>0, the tissue TAC is corrected by the scaled whole blood activity before the actual analysis.
Parameter Fitting
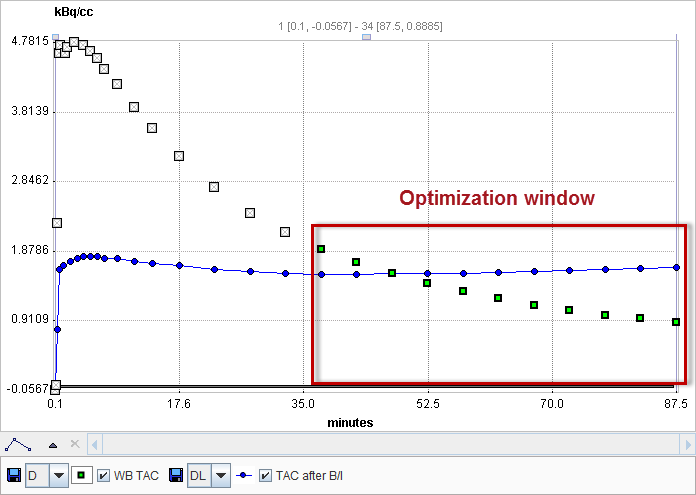
It is assumed that the data of a bolus study has been loaded. When the Bolus/Infusion Opt model is selected, the expected tissue activity according to the formula above is calculated using the default parameters, and shown as the model curve.
Kbol can be estimated. The user has to enter a reasonable equilibration time as the input parameter Start Equilibr. When Fit current region is activated, the optimal Kbol is calculated. The criterion for an equilibrium is that the calculated activities from Start Equilibr to the end of the scan are as constant as possible. Using the duration of the current data, the % Fraction of the dose in the syringe is displayed which is to be injected as the initial bolus.
Also, please note the following:
1.The same formulation holds for both TACs and input curves. However, Kbol can only be fitted with the TAC curve, not the input curve. For the blood curve, the Bolus/Infusion Opt model is only usable for visualizing the plasma response with an entered Kbol value which was obtained in TAC fitting.
2.If the Bolus/Infusion Opt model is applied to a TAC and the Fit blood is enabled in the Extras panel, the Bolus/Infusion Opt model is also applied to the plasma curve during the fit using the plasma model curve. Therefore the plasma model should be an interpolation model, NOT THE B/I model!Kbol is a common parameter in the fit, and the criterion is that both the expected TAC and the expected input curve are constant.
3.The Bolus/Infusion Opt model can be used for coupled fitting to find the optimal dose for several tissues. In a coupled fit, only the TACs are used, and the input curve is currently neglected (as opposed to 2).
4.The residual weighting of all curves involved in the fit should be set to constant weighting.
Reference
1.Carson RE, Channing MA, Blasberg RG, Dunn BB, Cohen RM, Rice KC, Herscovitch P: Comparison of bolus and infusion methods for receptor quantitation: application to [18F]cyclofoxy and positron emission tomography. J Cereb Blood Flow Metab 1993, 13(1):24-42. DOI