A common curve display object is used in all PMOD tools. It consists of a curve area and a controls area underneath.

In some situations the control area may initially be hidden. In this case, please open the context menu by right clicking into the plot area, and select Hide/Show curve controls.
Curve Area
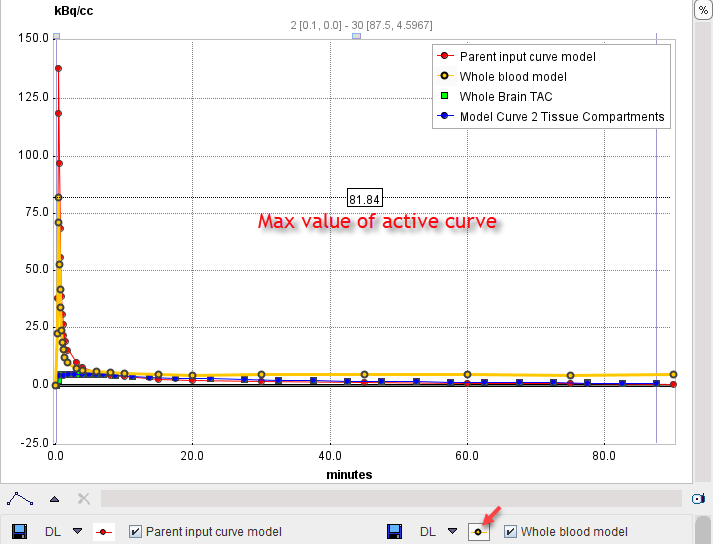
The curve area shows the curves which are enabled for display. There is always an active curve, which is shown in bold. A curve can be made active by holding down the CTRL key and clicking at one of its points, or by pushing its button in the controls area as illustrated with the Whole Brain TAC curve above.
The definition of the active curve is relevant for the tools which interrogate the curve values:
▪There are two small handles at the top of the curve area: a little rectangle to the left, and a line to the right. These are handles which can be moved left/right using the mouse, and the gray vertical lines move with them. The values at the top center of the curve area represent the interpolated (x/y) values of the active curve at the location of the handles. To get the measurements of a different curve just CTRL+Click at that curve to get the values updated.
▪Only in some curve displays: When the cursor is brought close to a point of the active curve, its x/y value pair is shown at the upper left of the curve area.
To zoom into an area of the curve just click the left mouse button to the corner of the area of interest and drag a rectangle. After releasing the mouse button the display is zoomed into the defined rectangle. An alternative is to define the axes range in the context menu. A single mouse click into the curve area is sufficient to reset the zoom.
Context Menu
By clicking the right mouse button into the curve area a context menu with some additional options can be opened.

The functions are:
Use restricted value range |
Set the range of the x- and y-axis by entering a numeric value. If the Use restricted value range box is checked, the range is maintained until the configuration is opened again and the check removed. Otherwise, a single click resets the range to the default. |
Reset interactive zoom |
To reset the curve range to the default full range. It is grayed if the display is not zoomed or the range is fixed. Mouse operation: single Click into curve area. |
Set closest curve active |
Selects the curve nearest to the point clicked with the right mouse button when opening the context menu. Alternative mouse operation: CTRL+Click at a curve. |
ON/OFF closest point |
Disable a measurement of the active curve. This is reflected by setting the symbol to gray.
In the context of model fitting measurements marked in gray are regarded as outliers and not considered when evaluating the cost function. Alternative mouse operation: select the relevant curve to active, then SHIFT+Click at measurement. |
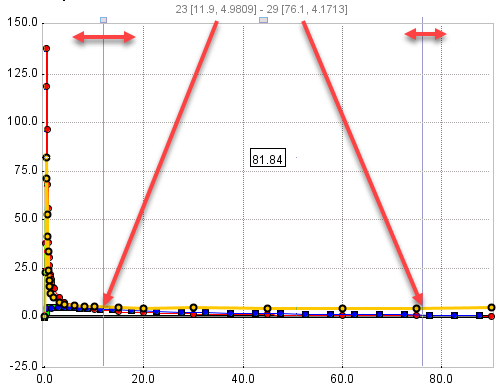
Switch ON/OFF all points in visible area |
In combination with zooming this option allows to quickly disable/enable a section of the active curve. |
|
Allows hiding the controls if the curve display area is small, and to show them again. |
Show/Hide curve names |
Controls, whether a box with the visible curve names is shown in the upper right. Note that if the available vertical space does not allow listing all names, the box is not shown. |
Show/Hide active curve max value |
|
Hide/Show grid lines |
Controls the display of the grid lines in the plot. |
Hide/Show vertical rulers |
Controls whether the rulers are shown which allow measurements on the active curve.
|
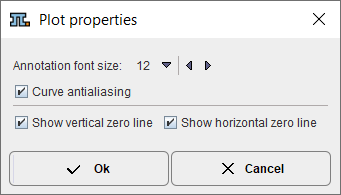
Plot properties |
With this entry a configuration dialog is opened for setting the annotation Font size, for enabling Curve antialiasing (smooth curve appearance), and for excluding the horizontal and vertical zero lines.
|
Show in separate window |
With this option, the curve display can be opened in a separate, large window to closely examine the plot. |
Save multiple curves |
Allows saving the numeric data of the curves in a single or separate text files. |
Value table of visible curves |
Opens a dialog window which shows the numeric values of all visible curves in a dialog window. The window contents can be copied to the Clipboard and pasted to a different application. |
Switch all curves ON/OFF |
To quickly change the visibility of all curves. When switching all off, the active curve is still shown. |


Curve Control Area
The control area lists the curves which are available for display. There are several elements to modify the curve appearance:

Show/Hide |
To show/hide a curve check/uncheck the visible box. |
Active curve |
To set a curve to active click at the active button, or directly CTRL+Click on the curve itself. The line/symbols get bold. |
Style |
The list selection can be used to change the style of a curve: |

Further useful interface elements:
|
Changes the shape of the lines defined by the measurements. Note that calculations are not based on the display representation of a curve. |
|
Saves the numeric data of the curve as a text file with two columns. These files obtain a .crv suffix and can easily be opened in Excel or a text editor. When working with a database the curve can be attached to a particular image using the Attach to Patient (Serie) in the appearing dialog.
|
|
If this button is enabled, each curve is normalized to its own maximum and shown as percent values. This mode is helpful for comparing shapes when the dynamic range of the curves is very different. |
|
Creates a capture of the curve area. The captured image can be saved as a JPEG, TIFF or DICOM file. It can also be copied to the Clipboard to paste it into some office application. |


