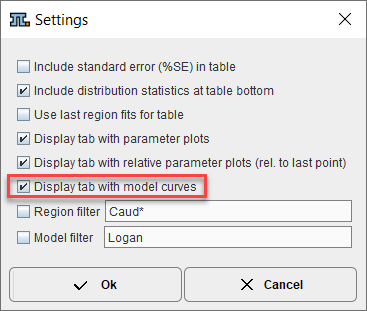
In addition to comparing the same data in different PKIN windows, model curves from different model fits can be plotted in a single curve display. The facility is accessible via the fitting history mechanism, after enabling Display tab with model curves.
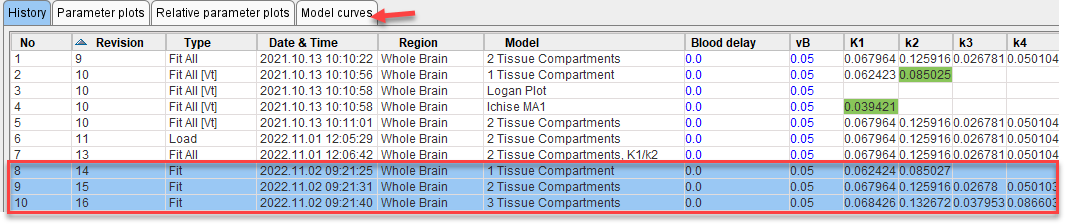
Now the model fits of interest can be selected on the History tab,
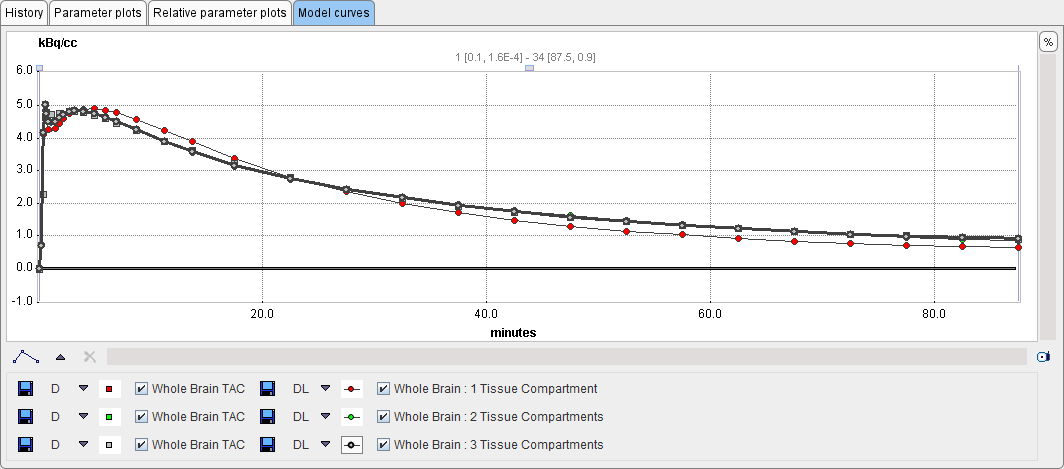
and the corresponding model curves together with their targets inspected in the Model curves panel.