Cropping and Time Averaging
Depending on the field-of-view of the scanner and the reconstruction settings, the heart may only cover a small fraction of the image volume. In order to ease processing it is recommended using a cropping procedure for restricting the image volume to the heart. Ideally, cardiac PET images should already be reconstructed with limited field-of-view centered at the heart, and with pixel sizes in the order of 2 mm.
The purpose of averaging the early (BLOOD) and the late frames (MYOCARDIUM) is to obtain images with optimal anatomical information to be used for the SA reorientation and myocardium detection. Their quality has a direct impact on the automatic procedures, and manual adjustments are also easier with clear images. There are various reasons why the images calculated with the default averaging settings may not be optimal:
▪Low injected activity, resulting in noisy images. Because of the dilution effect the tracer is not well seen in the cavity of the left ventricle (LV).
▪Delayed appearance of the bolus so that too much background is included in the calculation of the BLOOD images.
▪Poor tissue perfusion making the LV anatomy unclear. There is no real solution to overcome the problem. A workaround is using the BLOOD image as an additional guidance in outlining.
▪subject or heart motion causing a blurring of the MYOCARDIUM image.
The following procedure is recommended to generate optimal BLOOD and MYOCARDIUM images:
▪Compare the Stress and Rest series and decide, which images have better quality. Work on these images towards a satisfactory solution.
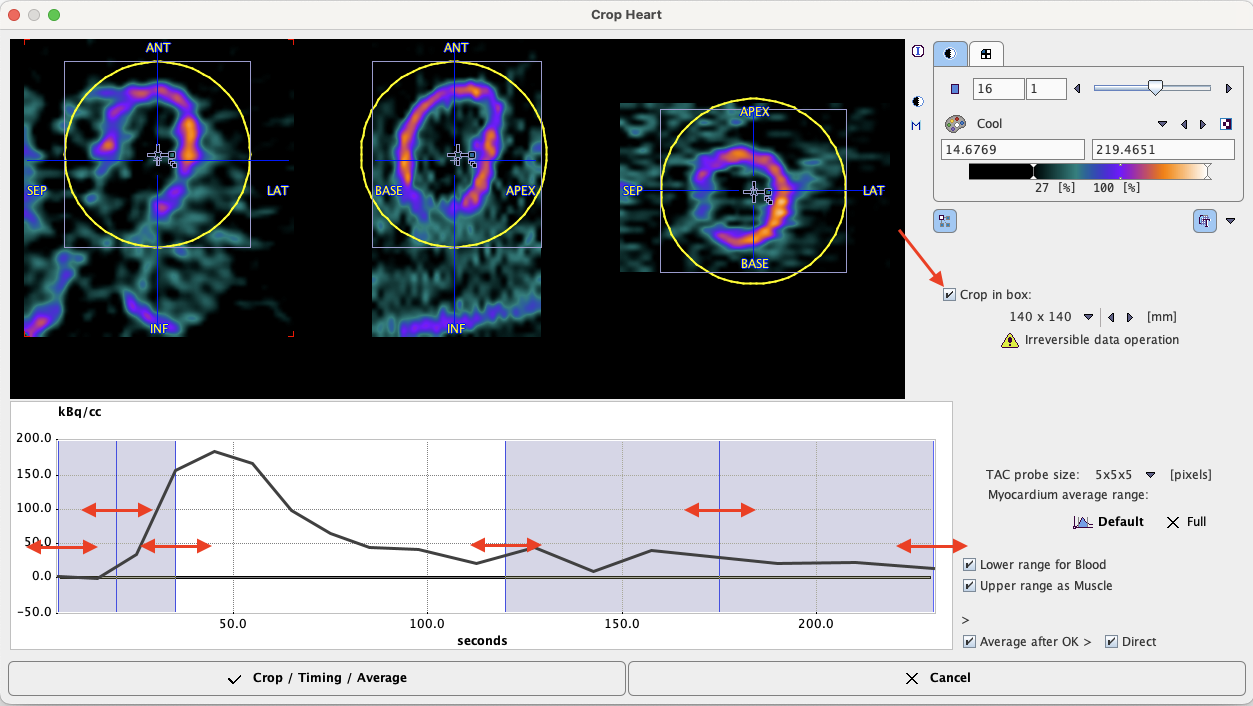
▪Select the button ![]() for the averaging process. A dialog window appears which allows to interactively specify a cropping window as well as the averaging ranges. The upper part of the window shows the average images. If the Crop in box check is enabled, a cropping volume is also indicated by yellow sphere. The center of this sphere can be placed by dragging the indicated handle. Its size can be changed with the list selection. Before proceeding, the sphere should be placed such that the whole heart is included in the box and that enough margin is allowed for the SA reorientation.
for the averaging process. A dialog window appears which allows to interactively specify a cropping window as well as the averaging ranges. The upper part of the window shows the average images. If the Crop in box check is enabled, a cropping volume is also indicated by yellow sphere. The center of this sphere can be placed by dragging the indicated handle. Its size can be changed with the list selection. Before proceeding, the sphere should be placed such that the whole heart is included in the box and that enough margin is allowed for the SA reorientation.
With each click an average time-activity curve (TAC) is calculated and shown in the lower curve panel. The sampling is performed by signal averaging around the triangulation mark with a configurable TAC probe size. The two shaded areas overlaid on the TAC represent the time ranges for frame averaging. First click into the blood pool of the LV. The TAC curve should show a clear initial peak. Adjust the left area by dragging with the mouse so that the peak is enclosed. Next click into the LV wall to generate a myocardium TAC. Adjust the right shaded area to cover the relevant portion of the late uptake. Activating the Default button the average range of the myocardium is set according to the configuration. If modeling only uses 4 min of the data, the myocardium averaging should not extend past 4 min to avoid motion mismatch.
The action button to continue is located in the lower left. It changes the naming according to the enabled options. With all options enabled (recommended) the button is labeled Crop/Timing/Average.
▪Cropping is an irreversible operation. Therefore an explicit confirmation is requested before it is executed. Note that cropping is only supported once. Thereafter, only changing of the time-averaging definition will be possible.
▪Before time-averaging is performed, a dialog window is opened which shows the frame ranges together with the smoothing filter settings based on the default configuration. If needed, they parameters may be modified.
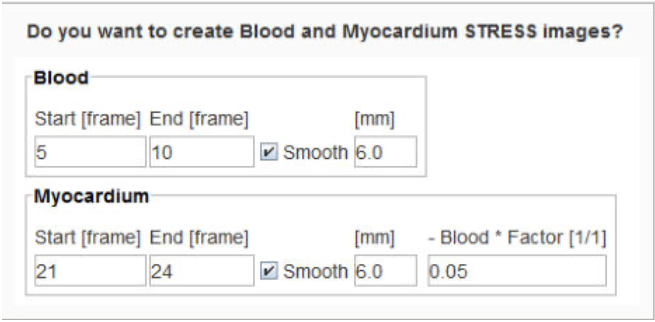
Upon confirmation, the averaging is performed as prescribed.
▪If the "automatic" checks for the SA reorientation and contouring are on, those two steps are also immediately performed.
Arrangement of the Result Images
Each time the time-averaging is performed, two new image series - BLOOD and MYOCARDIUM - are calculated, and the display is switched to MYOCARDIUM. The user can switch between the original study and the averaging results by the study selection as illustrated below.

The clearer the anatomy in the images is, the better will the automatic procedures work, and the easier will the analysis be. However, typically images of the following quality can be obtained. Due to the increasing dispersion of the bolus it is often difficult get a well delineated LV blood pool.

Potential Problems
Note that there are various reasons why the images calculated with the default averaging settings may not be optimal:
▪Low injected activity, resulting in noisy images. Because of the dilution effect the tracer is not well seen in the cavity of the left ventricle (LV).
▪Delayed appearance of the bolus so that too much background is included in the calculation of the BLOOD images.
▪Poor tissue perfusion making the LV anatomy unclear. There is no real solution to overcome the problem. A workaround is using the BLOOD image as an additional guidance in outlining.
▪subject or heart motion causing a blurring of the MYOCARDIUM image.